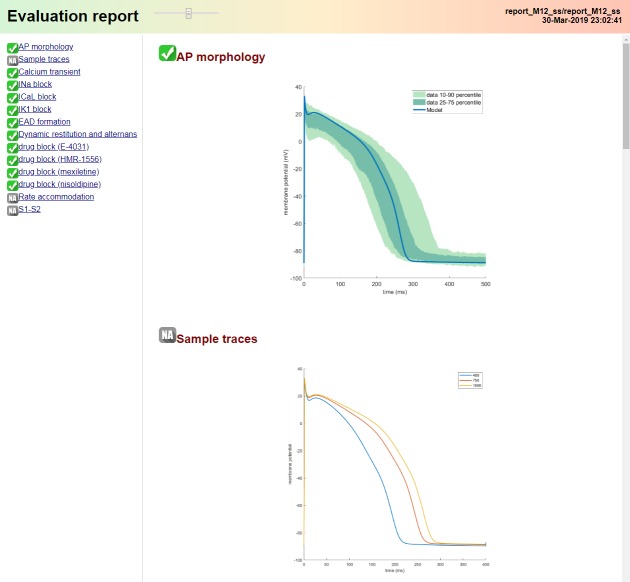
Appendix 1—figure 10. Evaluation pipeline.
The left menu shows a list of evaluation criteria with the adjacent icon indicating whether they are fulfilled by the model. The right pane contains figures visualising the model performance in the criteria. The figures can be either viewed by scrolling or by clicking the corresponding entry in the left menu. The report header contains a timestamp of the report generation and a slider which controls the size of figures in the right pane. The whole report is written in HTML, as automatically generated from Matlab code, and can be viewed in any internet browser.

