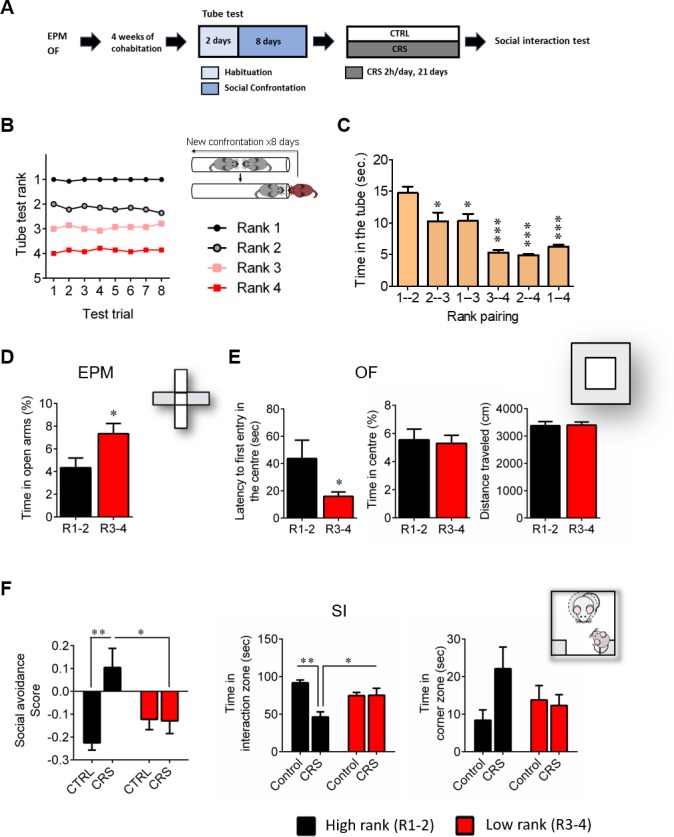
Figure 1. High rank mice exhibit susceptible behavioral phenotype after 21 days of chronic restraint stress.

(A) Experimental design of the restraint stress protocol. (B) Summary of nine cages representing the SCTT ranks and winning times as a function of SCTT trials over the 8 days of test. (C) Time spent in tube as a function of rank pairing (F5,35=18.19, p<0.0001, one-way ANOVA; *p<0.05, ***p<0.001, Bonferroni’s test, n = 7 per rank pairing). (D) Anxiety-like behaviors measured as the percent time spent in the open arms of an elevated plus maze after segregation into high rank vs low rank mice (p*<0.05, unpaired t-test, two-tailed, n = 14 per group). (E) Anxiety-related behaviors measured in the open-field, including latency to first enter the center of the arena (*p<0.05, unpaired t-test, two-tailed n = 14 per group) and time in center zone (n.s. unpaired t-test, two-tailed n = 14 per group). Locomotor activity is measured as the distance travelled in the OF (n.s. unpaired t-test, two-tailed n = 14 per group). (F) Social interaction (SI) test measured after chronic restraint stress protocol in high rank vs low rank animals (Social avoidance score: Interaction: F1,21=7.75, p<0.05; rank effect: F1,21=1.18, p>0.05; stress effect: F1,21=7.15, p<0.05, two-way ANOVA; p*<0.05, **p<0.01, Bonferroni’s test, n = 6–7 per group/Time in interaction zone: Interaction: F1,21=12.80, p<0.005; rank effect: F1,21=0.85, p<0.05; stress effect: F1,21=12.21, p<0.005, two-way ANOVA; p*<0.05, **p<0.005, Bonferroni’s test, n = 6–7 per group/Time in corner zone: Interaction: F1,21=3.29, p>0.05; rank effect: F1,21=0.28, p<0.05; stress effect: F1,21=2.14, p>0.05, two-way ANOVA, n = 6–7 per group). Data are displayed as mean ± SEM.
