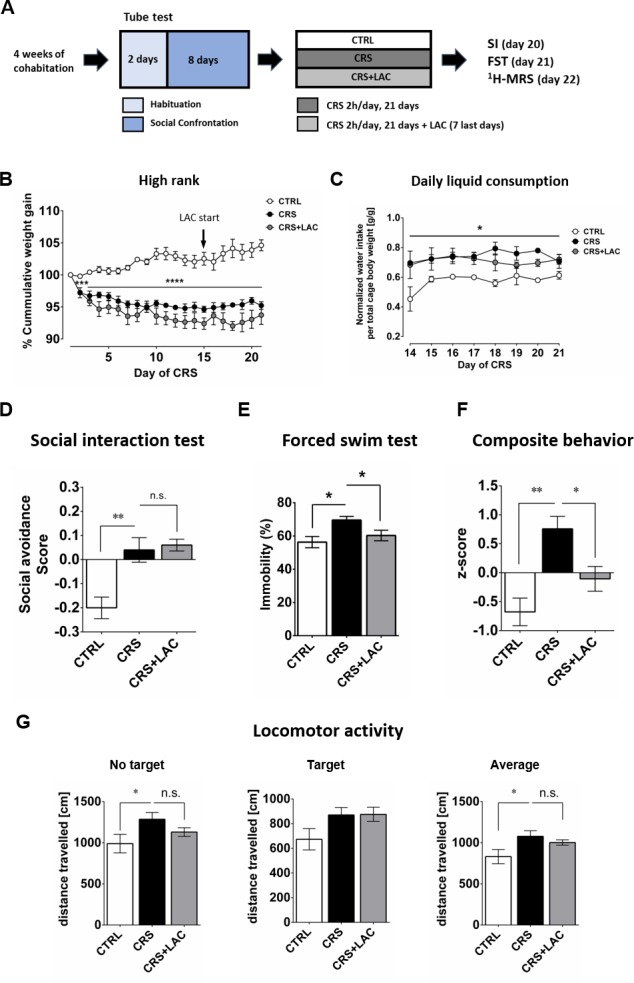
Figure 2. High rank mice respond to acetyl-L-carnitine treatment after chronic restraint stress.
(A) Experimental design of the restraint stress protocol and treatment procedure. (B) High rank mice show a reduction of cumulative weight gain during the restraint stress protocol (Interaction: F20,40=11.5, p<0.0001; stress effect: F2,10 = 45.0, p<0.0001, repeated measures two-way ANOVA; ***p<0.001, ****p<0.0001, Bonferroni’s test, n = 6 per group). The start of LAC treatment during CRS protocol is indicated with an arrow (day 14). (C) Daily water intake during the LAC treatment period (given during the last week of the CRS protocol) normalized by total body weight of the four mice per cage (Group effect: F2,4=17.0, *p<0.05; Interaction: F14,28=0.90, p>0.05; time effect: F7,14=1.24, p>0.05, repeated measures two-way ANOVA; n = 3 cages per group). Thus, water intake data represent the cage average value. Liquid consumption during the first days of the CRS protocol is shown in Figure 2—figure supplement 1B (D) Social avoidance scores measured after chronic restraint stress protocol in high rank mice (F2,15=12.08, p<0.01, one-way ANOVA; **p<0.01, Bonferroni’s test, n = 6 per group). (E) Behavioral despair measured with a forced swim test between high rank mice (F2,15=5.31, p<0.05, one-way ANOVA; *p<0.05, Bonferroni’s test, n = 6 per group). (F) Depressive-like behavior measured as a composite z-score component of social avoidance and immobility time between high rank mice (F2,15=10.31, p<0.005, one-way ANOVA; *p<0.05**p<0.005, Bonferroni’s test, n = 6 per group). (G) Locomotor activity measured during the SI test (No target present: F2,15=2.94, p>0.05, one-way ANOVA; *p<0.05, Bonferroni’s test/Target present: F2,15=2.79, p>0.05, one-way ANOVA;/Average: F2,15=3.67, p<0.05, one-way ANOVA; *p<0.05, Bonferroni’s test, n = 6 per group). Effect of LAC on low rank is shown in Figure 2—figure supplement 1.

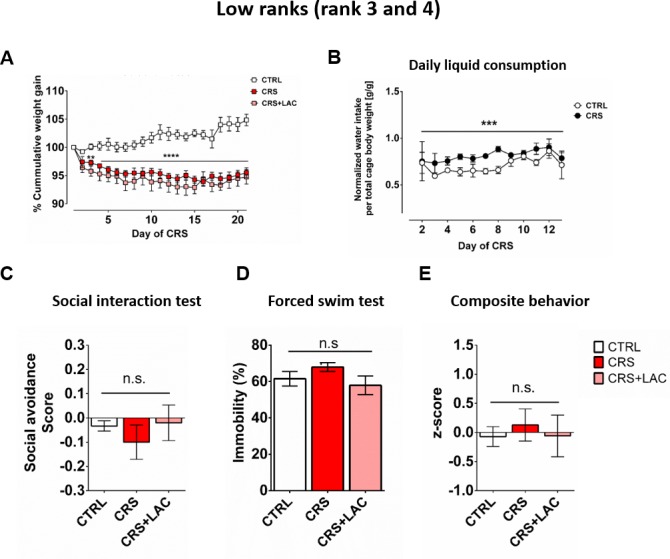
Figure 2—figure supplement 1. Physiological and behavioral readouts following CRS and LAC treatment in low rank mice.

