
Figure 3. The neurochemical profile of the nucleus accumbens measured with in vivo 1H-MRS at 14T.
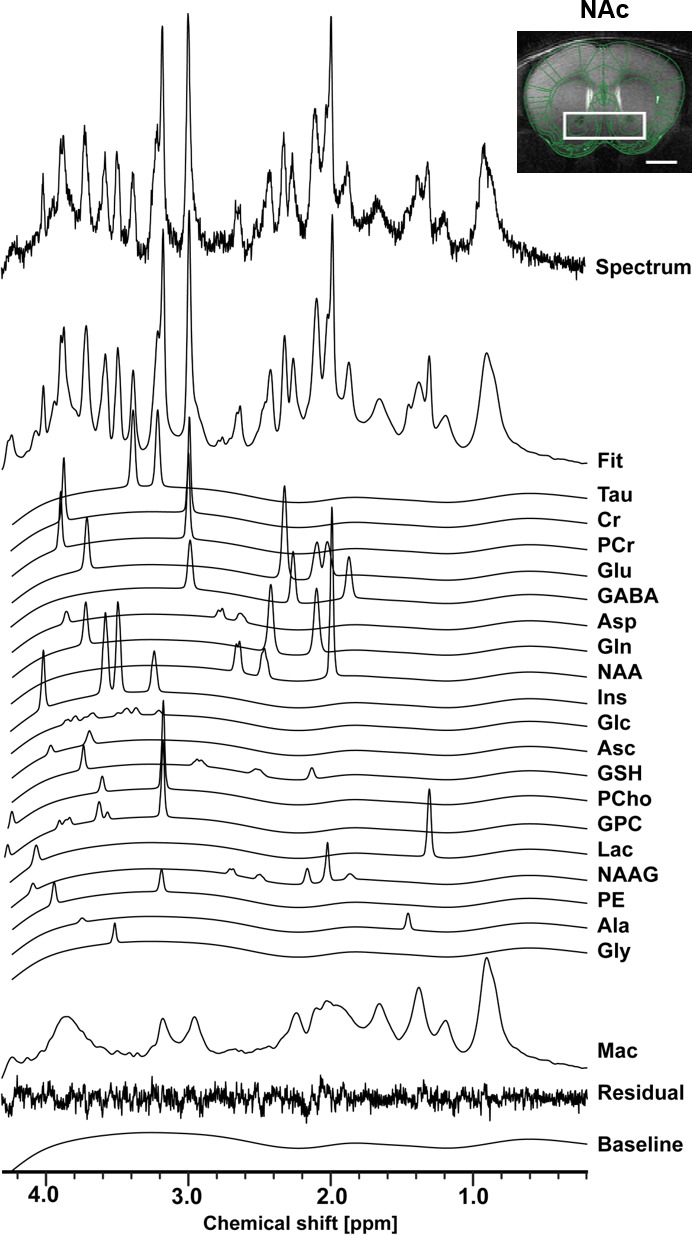
Spectrum fitting and neuroanatomical image of the NAc with respective voxel position in mouse brain. Spectrum is decomposed into the total fit, the individual metabolite components of the fit, the residual and the baseline, as a result of LCModel analysis. The fitted neurochemical profile included following metabolites: taurine (Tau), creatine (Cr), phosphocreatine (PCr), glutamate (Glu), γ-aminobutyric acid (GABA), aspartate (Asp), glutamine (Gln), N-acetyl-aspartate (NAA), myo-inositol (Ins), glucose (Glc), ascorbate (Asc), glutathione (GSH), phosphorylcholine (PCho), glycerophosphorylcholine (GPC), lactate (Lac), N-acetylaspartyl-glutamate (NAAG), phosphoethanolamine (PE), alanine (Ala), glycine (Gly), as well as macromolecules (Mac).