
Figure 4. Factor analysis identified one main factor that accounts for treatment-related effects in the metabolic profile of nucleus accumbens in high rank mice.
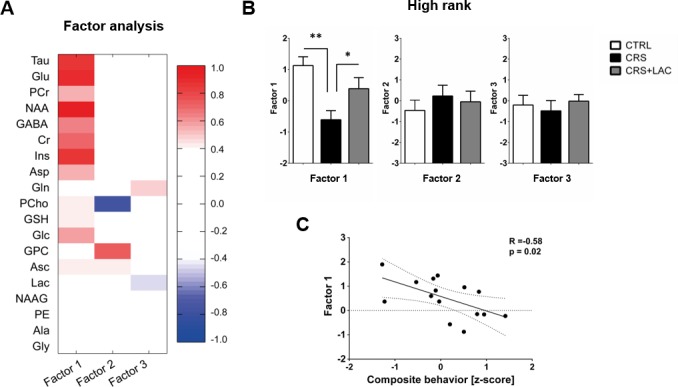
(A) Metabolites in the nucleus accumbens that load into Factor one, Factor two and Factor three of the factor analysis. The heat map represents the individual loadings of each metabolite into each factor. Factor one represents a linear combination that summarizes neurochemical changes including metabolites with strong contribution (above 0.5: Tau, Cr, PCr, Glc, Glu, GABA, Asp, NAA and Ins.) and moderate (0.4–0.5: GSH and Asc). (B) CRS and LAC treatment in CRS-treated high rank mice impact on Factor one metabolites (F2,13=7.04, p<0.01, one-way ANOVA; *p<0.05, **p<0.01, Fisher LSD test n = 5–6 per group) (C) Factor one correlates with the composite emotional (i.e., depressive-like) behavior in high rank animals (R = −0.58; p<0.05).