. 2020 Jan 10;9:e50631. doi: 10.7554/eLife.50631

Figure 5. Effect of CRS and LAC treatment in CRS-treated mice on the accumbal neurochemical profile of high rank mice for metabolites with strong loading on Factor one.

Metabolites from Factor one with strong loading (above 0.5) include Tau, Cr, PCr, Glc, Glu, GABA, Asp, NAA and Ins. The ratio of PCr/Cr is shown as well. CRS induces a drop in Tau, Glu, PCr, Asp and NAA. Only CRS-induced reductions in Tau and PCr are restored by LAC treatment. The neurochemical profile obtained for low rank mice is reported in Figure 5—figure supplement 1. One-way ANOVA followed by LSD Fisher post-hoc test, *p<0.05, n = 5–6 per group.
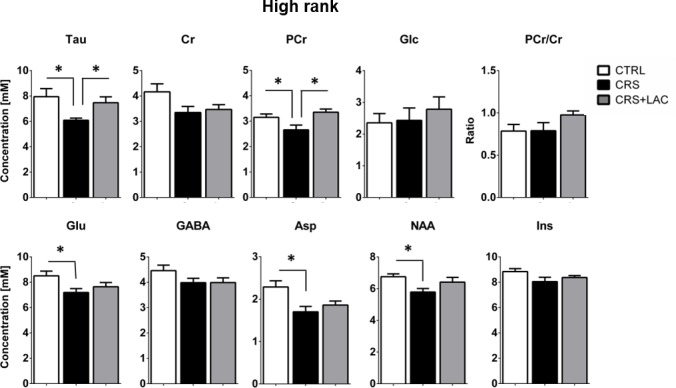
Figure 5.

Figure 5—figure supplement 1. Effect of LAC on the accumbal neurochemical profile of low rank mice after CRS.
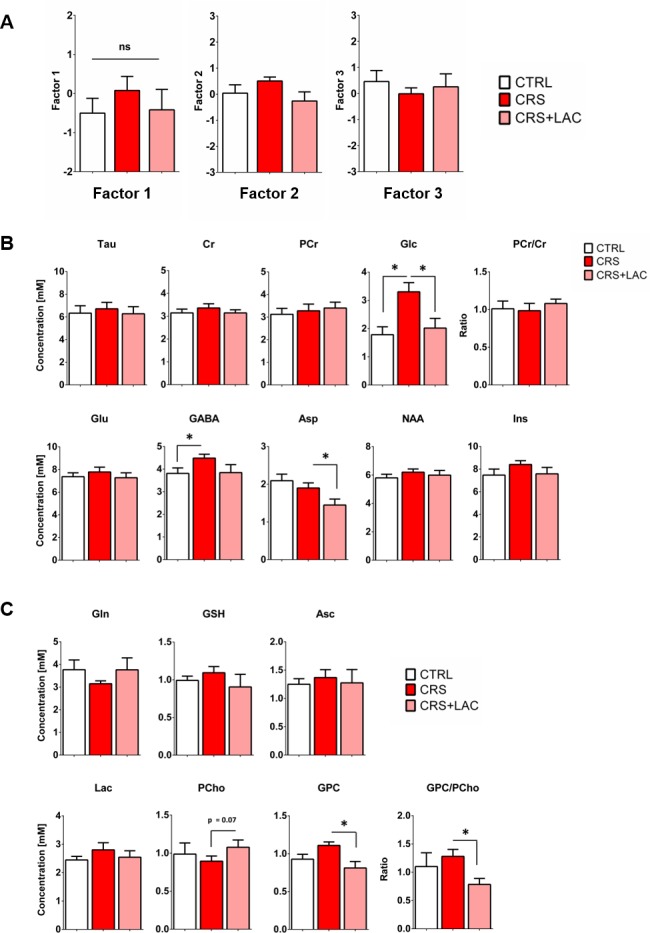
Figure 5—figure supplement 1.

(A) Factor analysis of the metabolic profile of nucleus accumbens of low rank mice after CRS. Factor one represents a linear combination that summarizes neurochemical changes including metabolites with strong (above 0.5: Tau, Cr, PCr, Glc, Glu, GABA, Asp, NAA and Ins.) and moderate (0.4–0.5: GSH and Asc) contribution in low rank mice (F2,15=0.54, p>0.05, one-way ANOVA; Fisher LSD test n = 6 per group). (B) Metabolites from Factor one with strong loading (above 0.5) Tau, Cr, PCr, Glc, Glu, GABA, Asp, NAA and Ins. The ratio of PCr/Cr is shown as well. One-way ANOVA followed by LSD Fisher post-hoc test, n = 5–6 per group. (C) Metabolites with moderate loadings (0.4–0.5) from Factor one and remaining metabolites from Factors two and three included Gln, GSH, Asc, PCho, Lac and GPC. The ratio of GPC/PCho was also reduced upon treatment. One-way ANOVA followed by LSD Fisher post-hoc test, *p<0.05, n = 5–6 per group. Overall, metabolite levels in low rank mice did not show substantial changes, except for Glc that was increased by CRS (p<0.05) and normalized by LAC treatment (p<0.05).