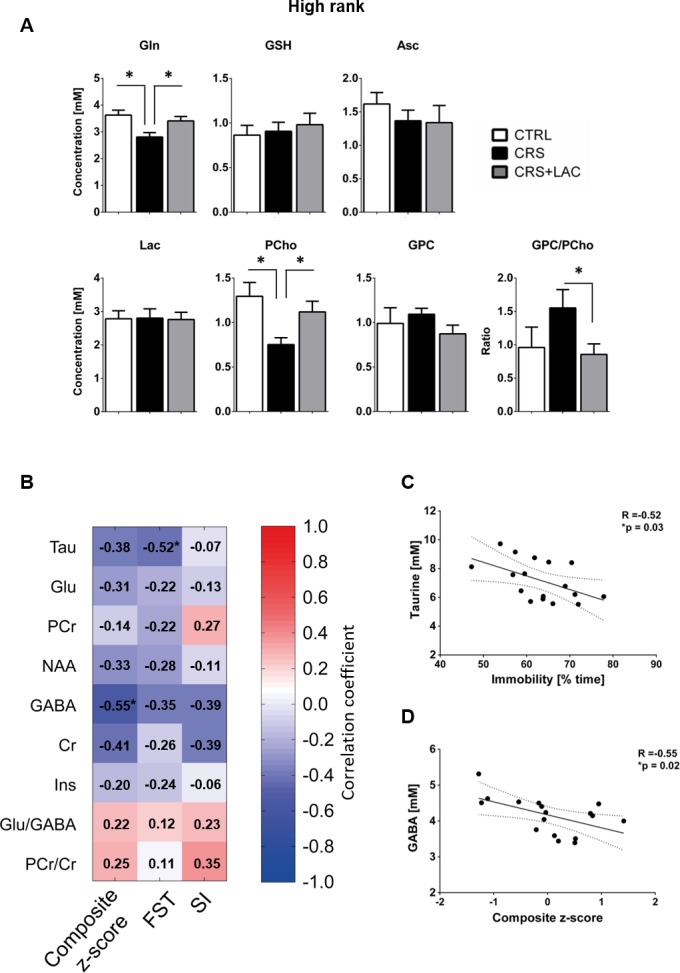
Figure 6. Effect of LAC on the accumbal neurochemical profile of high rank mice after CRS for remaining metabolites and associations between behavior and neurochemistry.

(A) Metabolites with moderate loadings (0.4–0.5) from Factor one and remaining metabolites from Factors two and three included Gln, GSH, Asc, Lac, PCho and GPC. The ratio of GPC/PCho is also shown. CRS induces a drop in Gln and PCho, which are both restored after LAC treatment. The GPC/PCho ratio is also lowered after LAC administration. One-way ANOVA followed by LSD Fisher post-hoc test, *p<0.05, n = 5–6 per group. (B) Correlation matrix between behavioral components and main metabolic targets of stress in the nucleus accumbens. Behavior included social interaction (SI) test, forced swim test (FST) and a composite behavior including both behaviors (Composite z-score). Each cell includes the Pearson’s correlation coefficient with the associated color scaling. (C) Scatter plot of behavioral despair and accumbal taurine. (D) Scatter plot of depressive-like behavior and accumbal GABA. *p<0.05, n = 16–18 per group.
