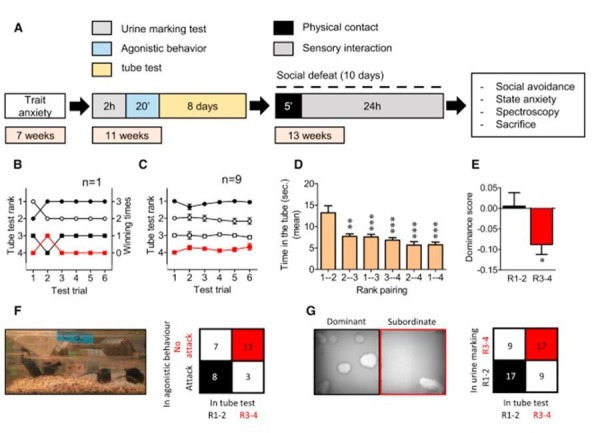
Author response image 1. Hierarchical Rank Using a Social Confrontation Tube Test.

(A) Illustration of the general timeline of the study. (B) Example of one cage representing the tube test ranks and winning times as a function of tube test trials. (C) Summary for nine cages over the 6-day test trials. (D) Time spent in the tube (s) as a function of the rank pairing (F5,48 = 9.78, p < 0.001, one-way ANOVA; ∗∗p < 0.01, ∗∗∗p < 0.001, Bonferroni’s test, n = 9 per rank pairing). (E) Dominance score after agonistic behaviors in the homecage (t28 = 2.30, ∗p < 0.05, unpaired t test, two-tailed n = 15 per group). (F) 2 × 2 contingency table for correlation between agonistic behaviors and tube test ranks (Fisher’s exact test, two-tailed, p = 0.050). (G) Left: picture representing typical urine marks profile of dominant and subordinate mice revealed by a UV light source. Right: 2 × 2 contingency table for correlation between urine marking test and tube test ranks (Fisher’s exact test, two-tailed, p = 0.026, n = 26 pairs). From Larrieu et al., 2017, Curr Biol..
