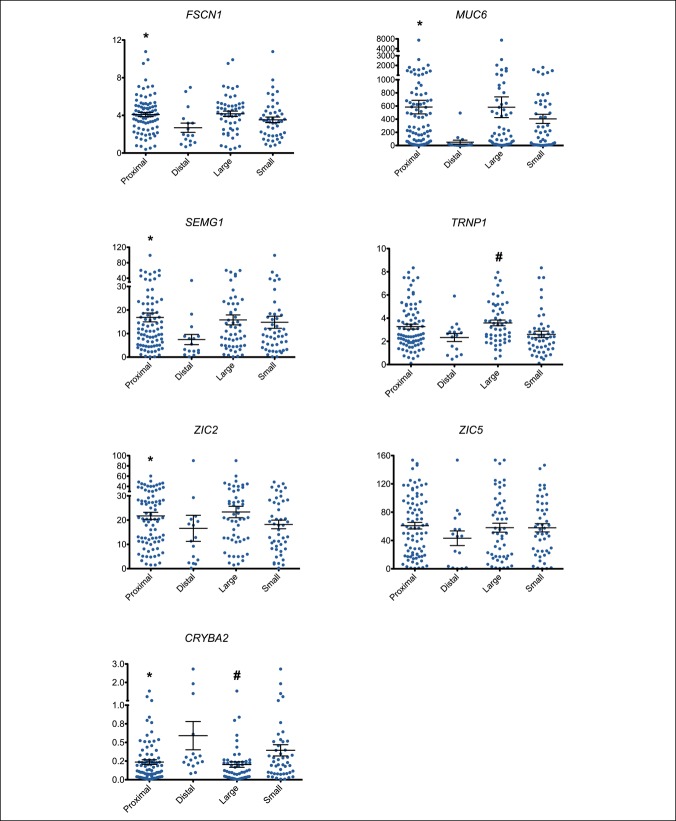
Figure 2.
RNA expression of the 7-gene panel based on the size and location of SSA/Ps (n = 99), graphing each gene individually (FSCN1, MUC6, SEMG1, TRNP1, ZIC2, ZIC5, and CRYBA2). Y axis shows the fold change in expression relative to the mean of HP expression. X axis shows each of the 4 groups (proximal-proximal to splenic flexure; large >/ = 10 mm). Mean ± SE bars are presented for each of the 4 groups. Mann-Whitney U-test statistics in GraphPad Prism 5.0d version software were used to determine statistical significance between sample groups. The expression of FSCN1, MUC6, SEMG1, ZIC2, and CRYBA2 was statistically significant (*P < 0.05) by location. The expression of TRNP1 and CRYBA2 was statistically significant (#P < 0.05) by size. HP, hyperplastic polyp.

