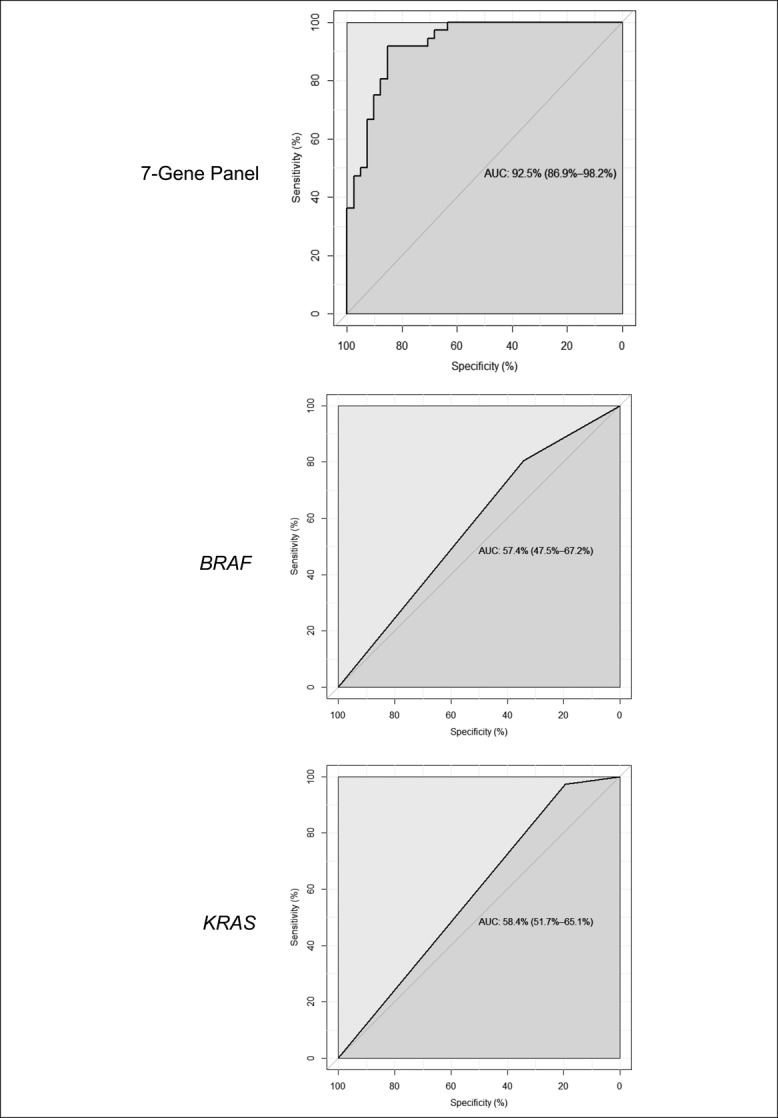
Figure 3.

ROC curves of the 7-gene expression panel (FSCN1, MUC6, SEMG1, TRNP1, ZIC2, ZIC5, and CRYBA2) (a), and BRAF (b) and KRAS (c) mutation data, showing relative sensitivity and specificity in distinguishing SSA/Ps (n = 36) and HPs (n = 41). Serrated polyps fulfilling 2 or 3 of 3 criteria were considered SSA/Ps, and serrated polyps fulfilling 0 or 1 of 3 criteria were considered HPs. The 7-gene panel had high sensitivity and specificity (AUC 92.5%) in differentiating SSA/Ps and HPs, whereas BRAF and KRAS mutations did not (AUCs 57.4% and 58.4%, respectively. AUC, area under the curve; ROC, receiver operator characteristic; SSA/P, sessile serrated adenoma/polyp.
