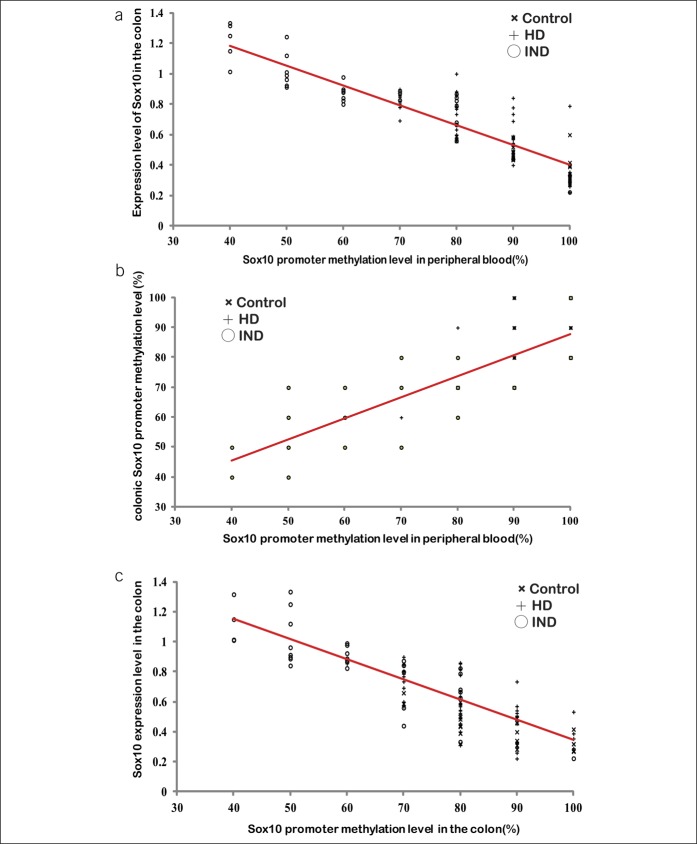
Figure 5.
Correlation analysis between the Sox10 promoter methylation level in the peripheral blood and the Sox10 expression level in the colon. (a) Correlation analysis between the Sox10 promoter methylation in the blood and its expression level in the colon (r = −0.89). (b) Correlation analysis between the levels of Sox10 promoter methylation in the peripheral blood and the colon (r = 0.84). (c) Correlation analysis between the Sox10 promoter methylation and its expression level in the colon (r = −0.83). The red lines are the correlation lines. HD, Hirschsprung disease; IND, intestinal neuronal dysplasia.

