
Figure 5.
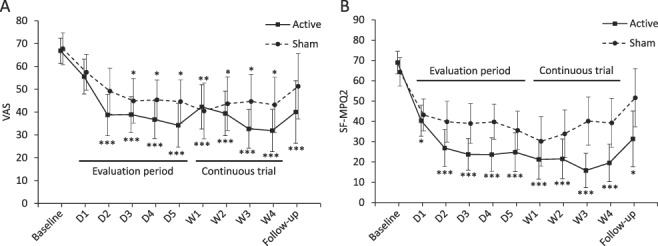
Time course of pain scores in patients enrolled in the continuous trial. The means and 95% CI are shown for (A) visual analogue scale (VAS) and (B) short-form McGill pain questionnaire 2 (SF-MPQ2) at baseline, after each intervention and at the last follow-up. Significant changes from the baseline are indicated as *P < 0.05; **P < 0.01; ***P < 0.001. CI, confidence interval; D, day; W, week.