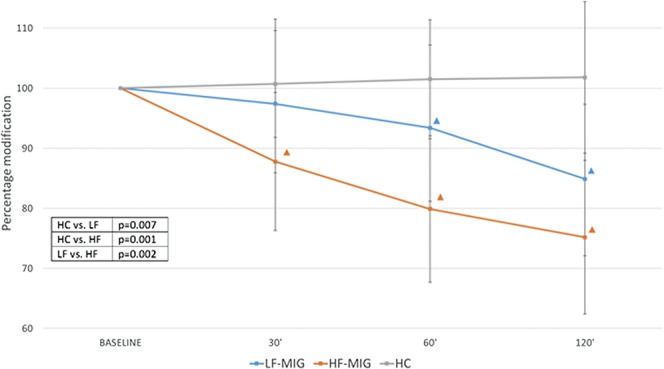
Figure 1.

Percent change of the temporal summation threshold after NTG administration in the experimental groups. HC, healthy controls; LF-MIG, low-frequency migraine group; HF-MIG, moderate- to high-frequency migraine group. ▲ intragroup analysis: time point vs baseline P < 0.05. In table: ANOVA intergroup post hoc comparisons. ANOVA, analysis of variance.
