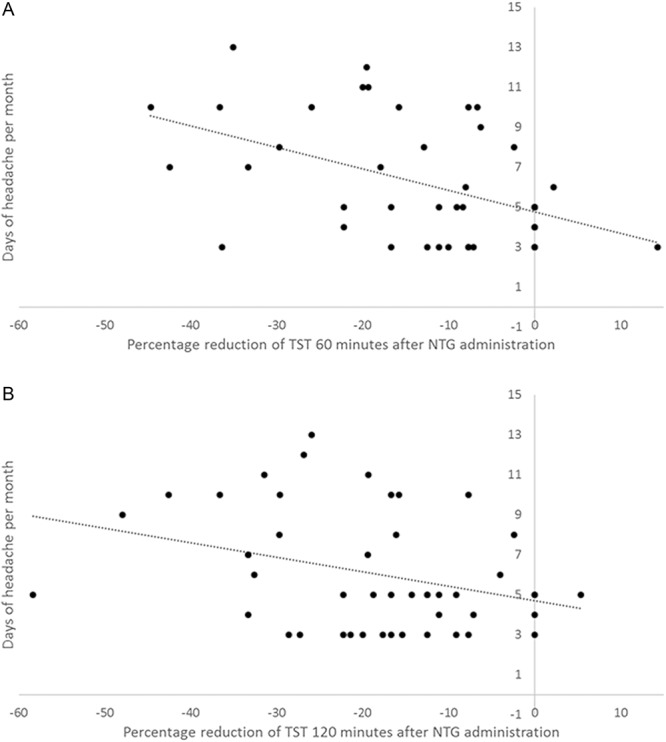
Figure 4.

Correlation between percentage modification of TST after NTG administration and days of headache per month. TST, temporal summation threshold of the NWR. Dotted line represents linear regression. Panel A: correlation between percentage reduction of TST at 60 minutes after NTG administration and days of headache per month: Pearson −0.491; P = 0.001. Panel B: correlation between percentage reduction of TST at 120 minutes after NTG administration and days of headache per month: Pearson −0.332; P = 0.023. NWR, nociceptive withdrawal reflex.
