Figure 5.
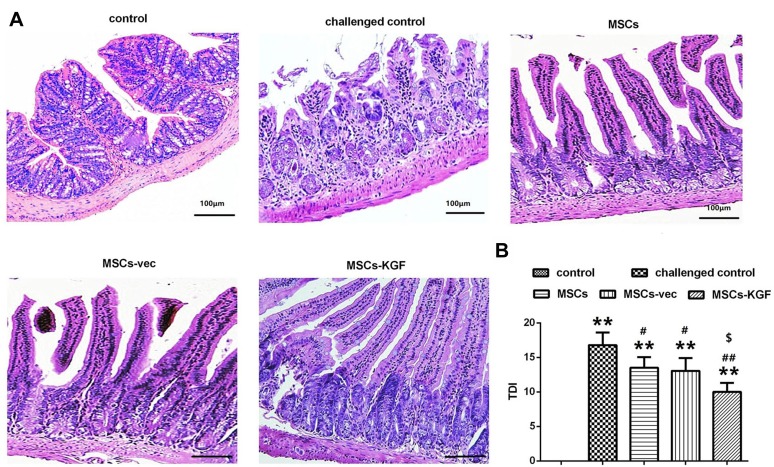
Pathological observation and TDI score. (A) HE staining was used to observe the pathological changes of intestinal tissue in each group of rats. Scale bar = 100 μm. (B) Comparison of TDI scores of rats in each group. n=10. Data shown are mean±SD. **p<0.01 vs control group; #p<0.05, ## p < 0.01, vs Model group; $p<0.05, vs MSCs group.
Abbreviations: MSCs, mesenchymal stem cells; KGF, keratinocyte growth factor.

