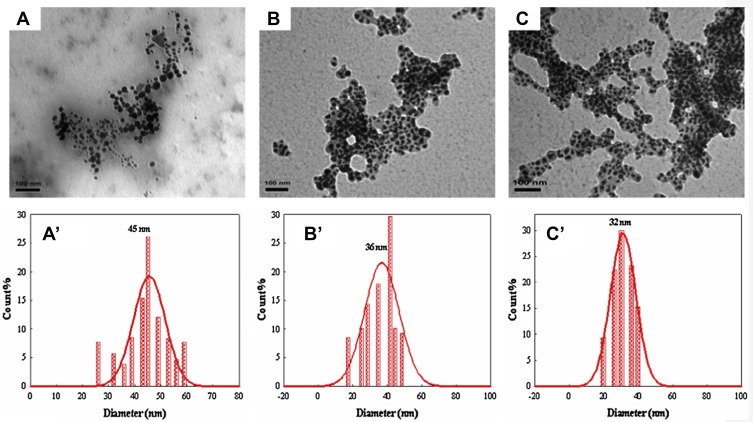
Figure 6.
TEM micrographs of gold nanoparticles prepared with (A) 100, (B) 200 and (C) 400 lL of a P. dactylifera extract. The corresponding histograms are represented by (A’), (B’) and (C’).83 “Reprinted from Spectrochimica Acta Part A: Molecular and Biomolecular Spectroscopy, 121, Mervat F. Zayed,Wael H. Eisa, Phoenix dactylifera L. leaf extract phytosynthesized gold nanoparticles; controlled synthesis and catalytic activity, 238-244, Copyright (2014), with permission from Elsevier.”.

