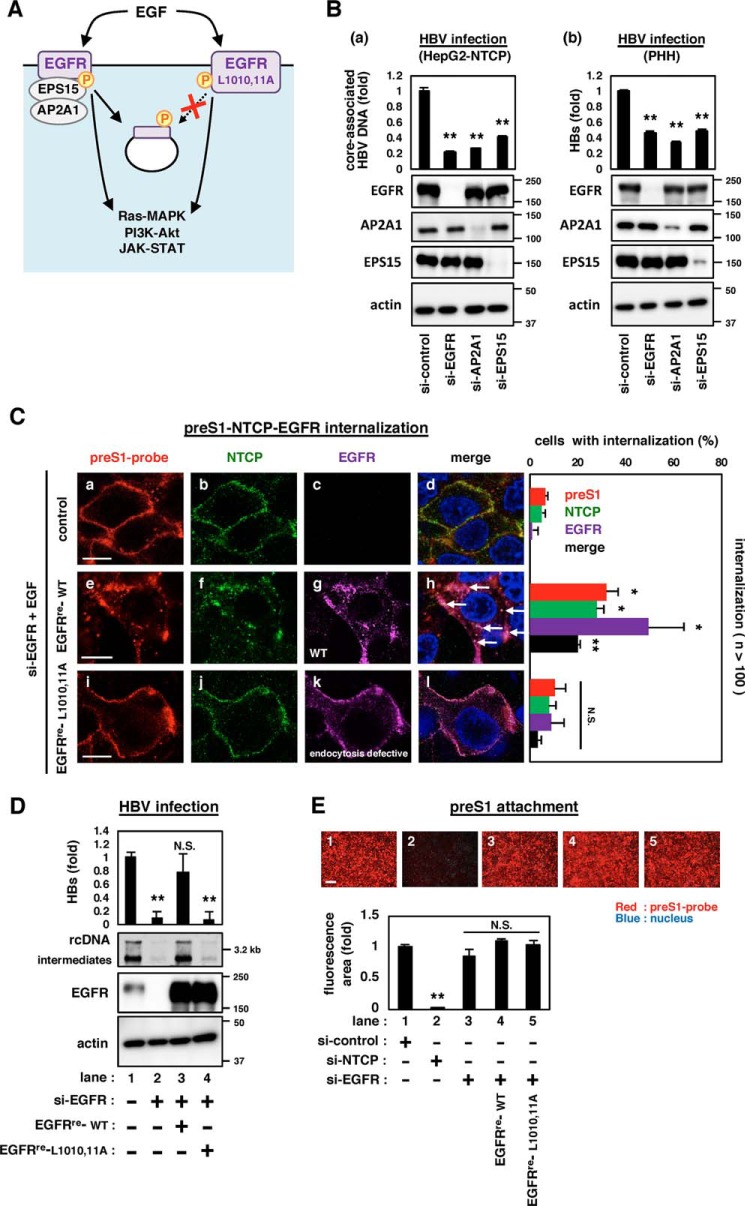
Figure 2.
EGFR endocytosis was essential for mediating HBV internalization. A, schematic representation of the downstream events after activation of EGFR (left) and its mutant of Leu-Leu at 1010 and 1011 to Ala-Ala (EGFR-L1010,11A) (right). EGFR-L1010,11A is deficient in endocytosis, while possessing the intact potential to activate the EGFR-downstream signaling. B, HBV infection was evaluated by quantifying the core-associated HBV DNA in HepG2-NTCP cells (a) or the extracellular HBs of primary human hepatocytes (b) transfected with siRNAs against the indicated target gene. EGFR, AP2A1, and EPS15 as well as actin as an internal control were detected by immunoblotting (bottom panels). C, internalization of HBV preS1 (red), NTCP (green), and EGFR (purple) was evaluated by confocal microscopy. si-EGFR–transfected HepG2-NTCP cells transduced with or without either EGFRre-WT or EGFRre-L1010,11A were exposed with a fluorescence-labeled myristoylated preS1 peptide (amino acids 2–48) (preS1 probe) at 4 °C to allow attachment. After washing, the cells were then stimulated with EGF at 37 °C for 30 min to allow preS1 internalization and were observed by immunofluorescence. Scale bars, 10 μm. The percentages of cells in which preS1, NTCP, and EGFR were internalized as speckles are indicated in the right graph (n >100). D, HBV infection was examined in HepG2-NTCP cells transfected with (lanes 2–4) or without (lane 1) si-EGFR and transduced with GFP (lane 1,2), EGFR (EGFRre-WT) (lane 3), or its mutant, EGFRre-L1010,11A (lane 4) that has si-EGFR–resistant substitutions. HBV infection was evaluated with HBs by ELISA (top graph) and HBV DNA by Southern blotting (top panel). Protein expressions are also shown in the bottom panels. E, HBV preS1-cell attachment was evaluated by using the cells transfected with the indicated siRNAs (si-control, si-NTCP or si-EGFR) and transduced with or without EGFRre-WT or EGFRre-L1010,11A as shown under “Experimental procedures” (top pictures). Scale bars, 200 μm. The bottom graph shows the quantification of the fluorescence attached to the cells. Error bars, S.D. The reproducibility of the data was confirmed in three independent experiments. *, p < 0.05; **, p < 0.01; N.S., not significant.

