Figure 1.
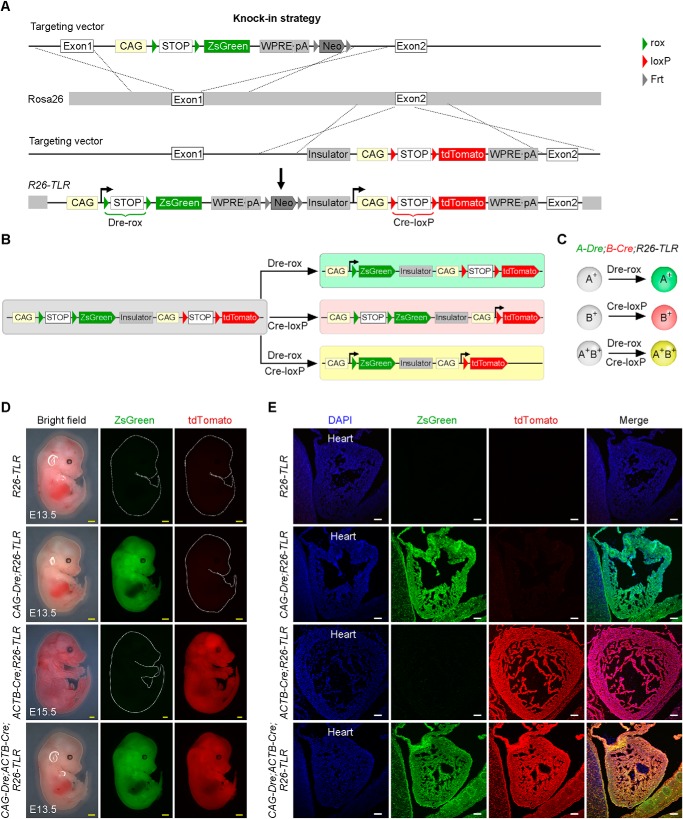
Generation and characterization of the R26-TLR mouse line. A, schematic showing the knock-in strategy of R26-TLR by homologous recombination. B and C, schematics showing the results after Dre-rox or Cre-loxP recombination. D, whole-mount bright-field and epifluorescence images of E13.5 embryos of R26-TLR, CAG-Dre;R26-TLR, CAG-Dre;ACTB-Cre;R26-TLR, and E15.5 embryos of ACTB-Cre;R26-TLR. E, immunostaining for ZsGreen and tdTomato on the indicated embryos sections in D. Yellow scale bars = 1 mm; white scale bars = 100 μm. Each image is representative of five individual samples.

