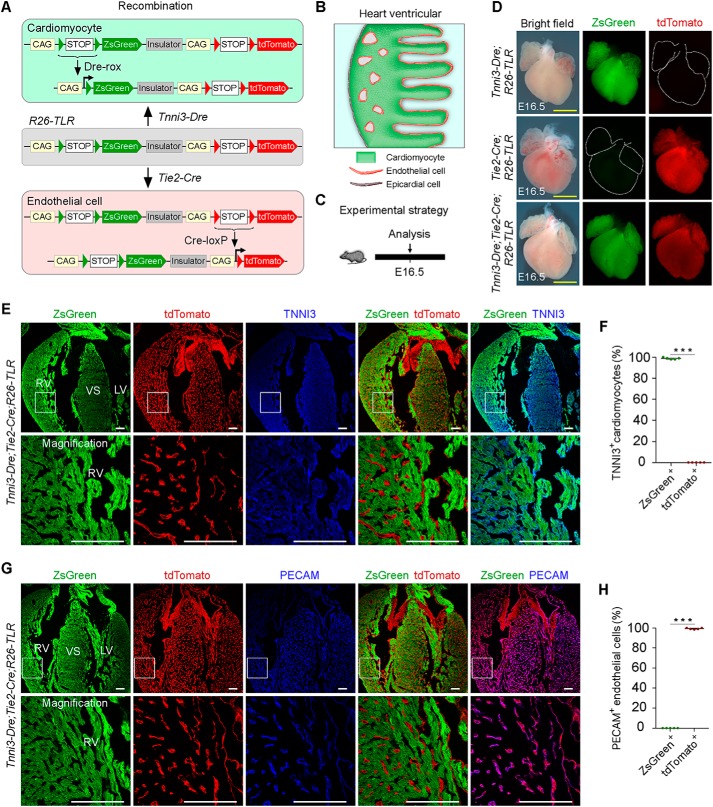
Figure 2.
Simultaneous labeling and tracing of cardiomyocytes and endothelial cells in Tnni3-Dre;Tie2-Cre;R26-TLR mice. A and B, schematics showing the results after Dre-rox and Cre-loxP recombination in Tnni3-Dre;Tie2-Cre;R26-TLR mice. C, schematic showing the time point for tissue analysis. D, whole-mount bright-field and epifluorescence images of E16.5 embryos of Tnni3-Dre;R26-TLR, Tie2-Cre;R26-TLR, and Tnni3-Dre;Tie2-Cre;R26-TLR. E, immunostaining for ZsGreen, tdTomato, and TNNI3 on E16.5 Tnni3-Dre;Tie2-Cre;R26-TLR heart sections shows that TNNI3+ cardiomyocytes are ZsGreen+ tdTomato−. F, quantification of the percentage of TNNI3+ cardiomyocytes labeled by Tnni3-Dre;Tie2-Cre;R26-TLR. Data are mean ± S.D. *, p < 0.001 by two-tailed t test. G, immunostaining for ZsGreen, tdTomato, and PECAM on E16.5 Tnni3-Dre;Tie2-Cre;R26-TLR heat sections shows that PECAM+ endothelial cells are tdTomato+ ZsGreen−. Boxed regions are magnified in the bottom panels. H, quantification of the percentage of PECAM+ endothelial cells labeled by Tnni3-Dre;Tie2-Cre;R26-TLR. Data are mean ± S.D. *, p < 0.001 by two-tailed t test. LV, left ventricle; RV, right ventricle; VS, ventricular septum. Yellow scale bars = 1 mm; white scale bars = 100 μm. Each image is representative of five individual samples.

