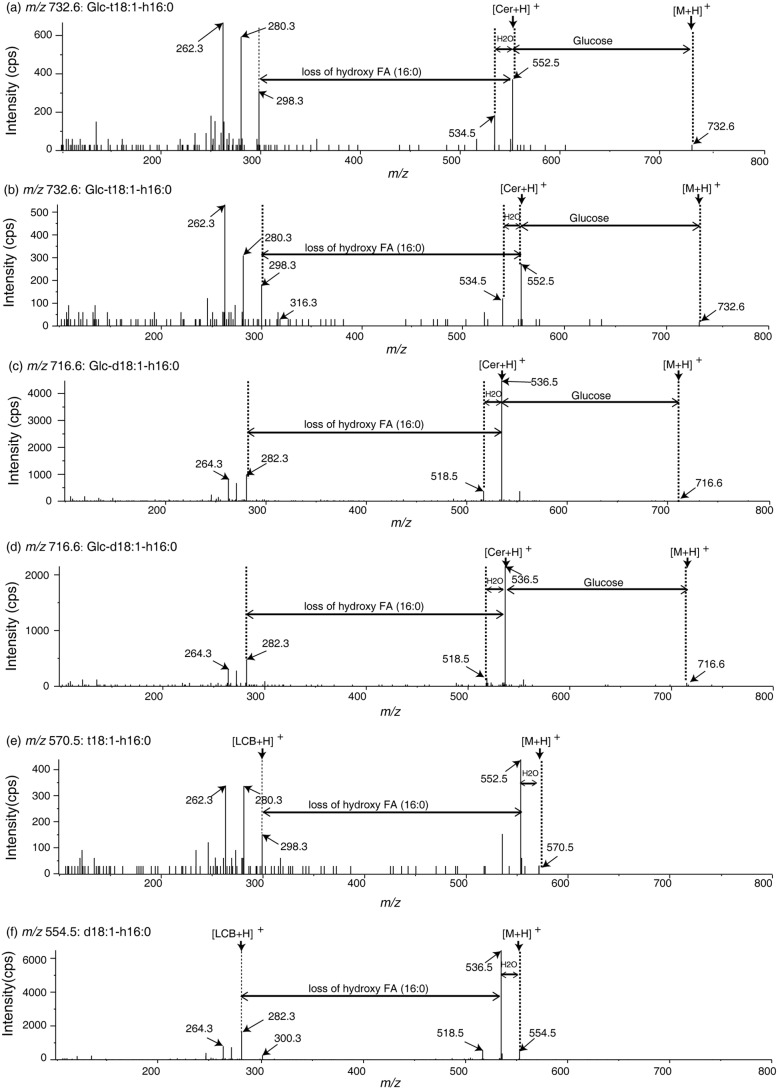
Figure 5.
Mass spectra of glucosylceramides and the product hydroxyceramides. a–d, mass spectra of purified natural GlcCer containing Glc-t18:1-h16:0 (a and b: m/z 732.6) and Glc-d18:1-h16:0 (c and d: m/z 716.6) with or without recombinant AtGCD3, as shown in Fig. 4. e and f, MS/MS spectra showing that C16 hydroxyceramide was generated through hydrolysis of relevant GlcCers with recombinant AtGCD3. t18:1-h16:0 (e, m/z 570.5) and d18:1-h16:0 (f, m/z 554.5) were hydrolyzed products of Glc-t18:1-h16:0 (b) and Glc-d18:1-h16:0 (d), respectively. The two-way arrows indicate neutral loss of sphingolipids, and one-way arrows show the product ion.

