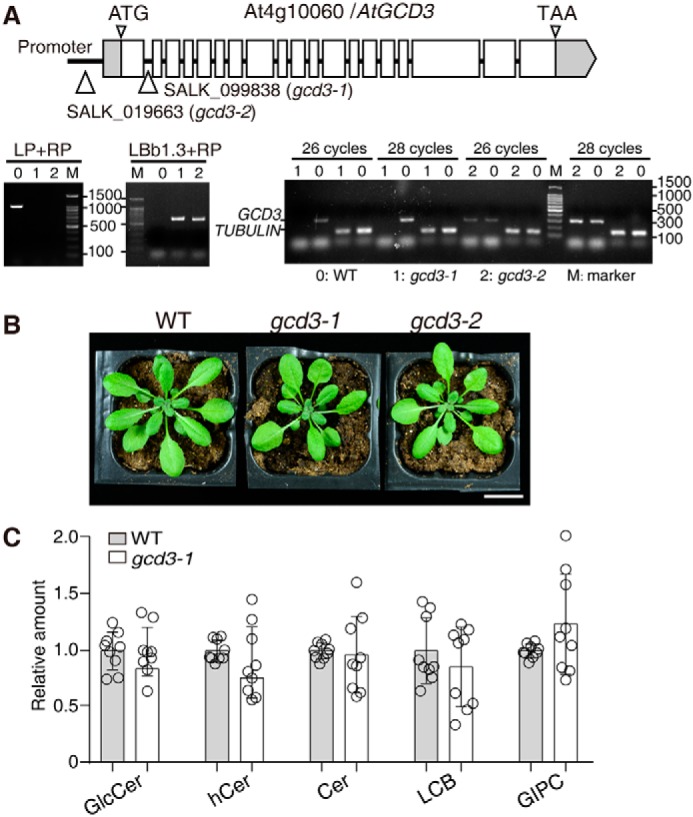
Figure 7.

Characterization of T-DNA insertion mutants of AtGCD3. A, schematic diagram of the GCD3 locus. Gray boxes, UTR; white boxes, exons. Thin lines between exons represent introns. T-DNA was inserted in the promoter region of AtGCD3 in SALK_019663 (gcd3-2) and was inserted in the first intron of AtGCD3 in SALK_099838 (gcd3-1). The triangles indicate the insertion sites. The T-DNA insertion mutants gcd3-1 and gcd3-2 were homozygotes, as verified by two-round PCR. Primer LBb1.3 and RP indicated the existence of the T-DNA insertion, and primer LP and RP showed that both are homozygotes. RT-PCR confirmed that gcd3-1 was a genuine null mutant. TUBULIN was used as an internal control. B, normal phenotype of a 32-day-old gcd3-1 plant. Bar, 2 cm. C, sphingolipid profiles of 3-week-old rosette leaves of WT and gcd3-1 plants. The contents of sphingolipid in WT and gcd3-1 plants were quantified after extraction, separation, and identification by HPLC ESI-MS/MS as described under “Experimental procedures.” All data are available in Table S1. The relative values indicate the level of sphingolipids in gcd3-1 relative to that found in WT (set as 1). The values represent the mean ± S.D. (error bars) (n = 9 independent experiments). Significance was determined using Student's t test.
