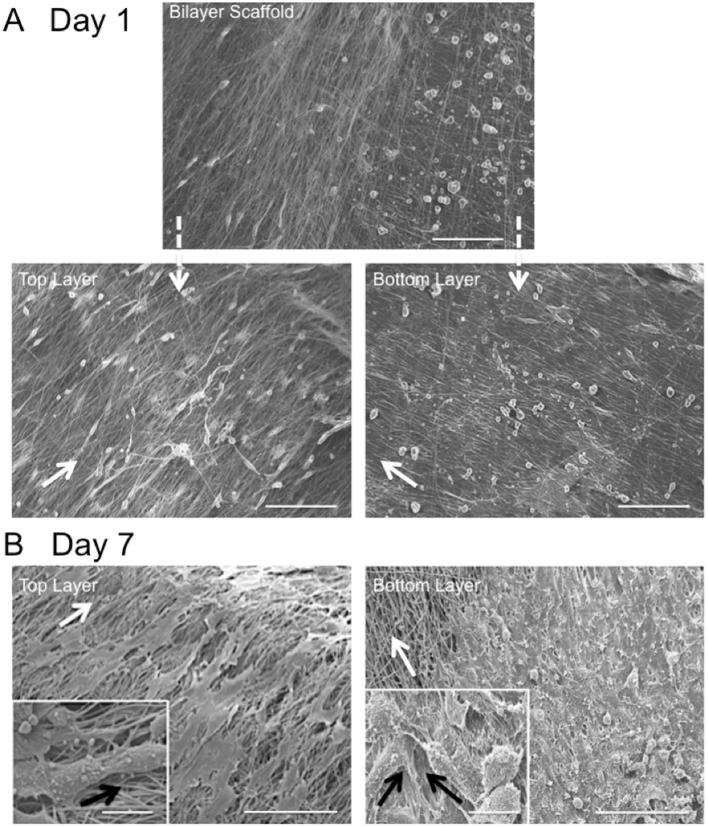
Figure 4.
Scanning electron microscopy images of in vitro AF cell alignment on PCL:PLLA electrospun bilayer scaffolds after (A) 1 (magnification x270; Scale bar = 100 μm) and (B) 7 days in culture (main images represent low magnification (x370; Scale bar = 100 μm); inset images represent high magnification (x1,500) (Scale bar = 20 μm). White arrows indicate main fiber direction. Black arrows indicate cells' direction.

