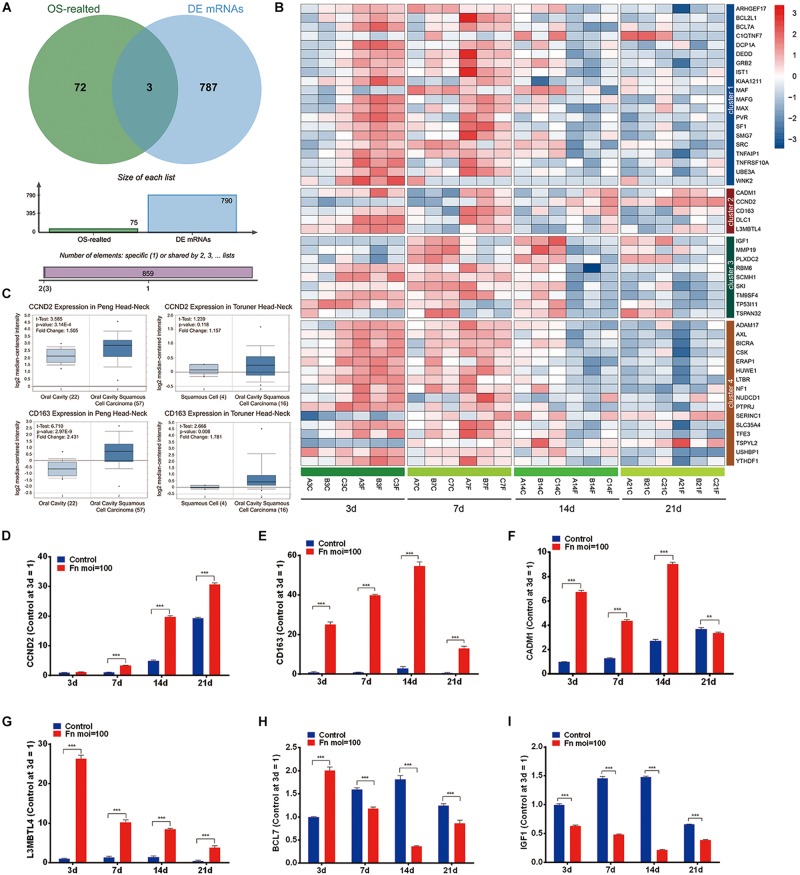
FIGURE 4.
Screening of the TAGs. (A) Venn analysis of the carcinogenesis genes for all the TAGs and all significant time-series DEGs (cancer-related genes: all TAGs in the CTD database; DEGs: all co-regulated DEGs). (B) Heatmap of the 50 overlapping DEGs. (C) The expression levels of the CCND2 and CD163 genes in the normal oral cavity and the oral squamous cell carcinoma. The levels of gene expression of CCND2 (D), CD163 (E), CADM1 (F), L3MBTL4 (G), BCL7 (H), and IGF1 (I) with F. nucleatum stimulation (MOI values of 0 and 100) at 3, 7, 14, and 21 day, as determined by qRT-PCR. ∗∗P < 0.01 and ∗∗∗P < 0.001.

