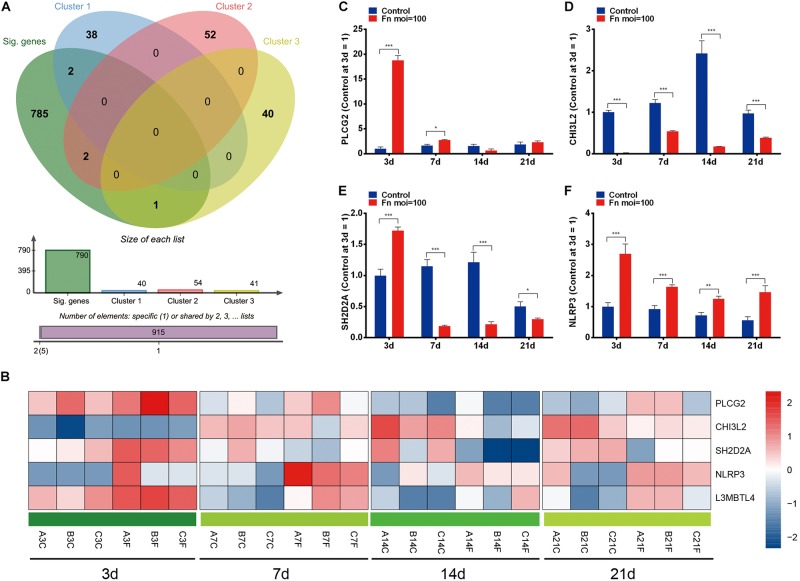
FIGURE 6.
Dynamic DEGs regulated by F. nucleatum in a time-dependent manner. (A) Venn analysis of time-course DEGs and genes with significantly enriched profiles in F. nucleatum-stimulated GMSCs. (B) Heatmap of the 5 dynamic DEGs generated by time-series F. nucleatum infection. The relative gene expression of the dynamic DEGs: (C) PLCG2, (D) CHI3L2, (E) SH2D2A, (F) NLRP3, as determined by qRT-PCR. ∗P < 0.05, ∗∗P < 0.01 and ∗∗∗P < 0.001.

