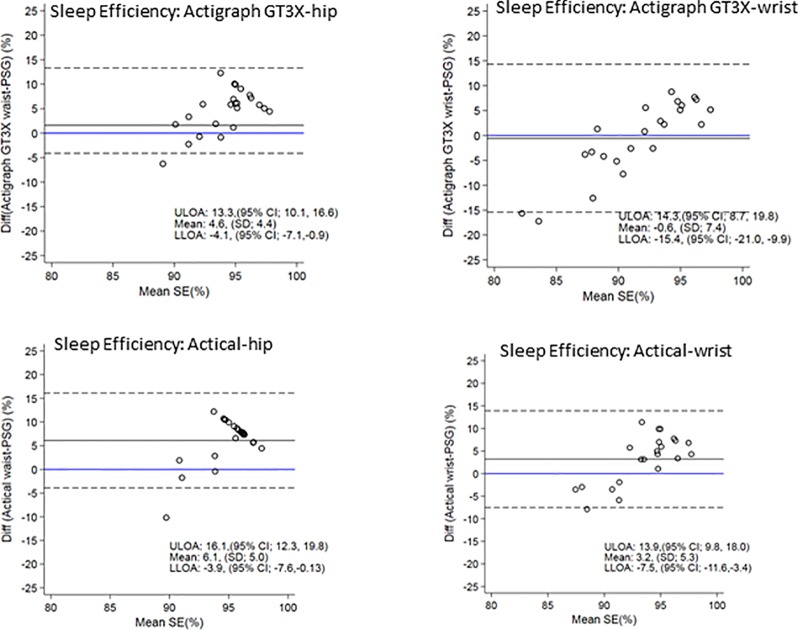
Figure 4.
Bland Altman plots of TST differences between Acticals and PSG are on the y-axis and means are on the x-axis. Perfect agreement is shown by the blue line crossing zero on the y-axis. Mean differences are represented by black solid lines and the upper and lower levels of agreement by dashed lines. ULOA, Upper Limit of Agreement; LLOA, Lower Limit of Agreement; TST, Total Sleep Time.

