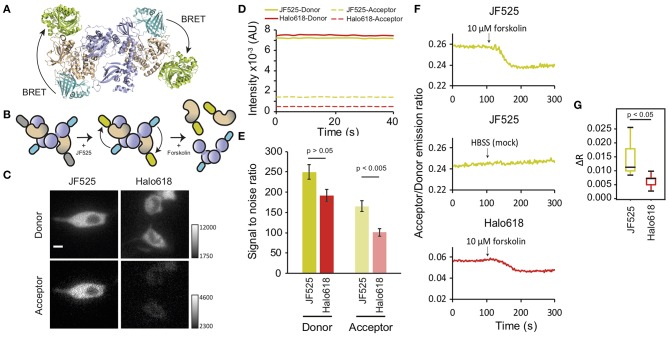
Figure 3.
Dissociation of PKA subunits observed by BRET. (A) Interaction of NL-RS and CS-HT modeled with the crystal structures (PDB files: 2QBVS, 2F7E, 5IBO, 5Y2Y). The regulatory subunit is shown in purple, catalytic subunit in wheat, NanoLuc in cyan, and HaloTag in greenish-yellow. (B) Schematic explaining the decrease in BRET upon dissociation of PKA subunits. The tetrameric structure of tagged NL-RS and CS-HT under resting condition (left) is labeled with HaloTag ligands (middle) and stimulated with forskolin to dissociate the interaction of RS and CS (right). (C) Luminescence images of NIH3T3 cells co-expressing NL-RS and CS-HT. Images were acquired after loading respective HaloTag ligands (JF525 and Halo618). All images were acquired with identical camera settings. Scale bar = 10 μm. (D) Representative intensity traces of donor and acceptor signals and (E) Mean SNR ± SEM for cells labeled with either JF525 or Halo618. (F) Time traces of acceptor/donor emission ratios showing dissociation of PKA subunits NL-RS and CS-HT upon forskolin stimulation (indicated by black arrow). (G) Box plot showing ΔRA/D values for cells labeled with respective HaloTag ligands. n = 8.

