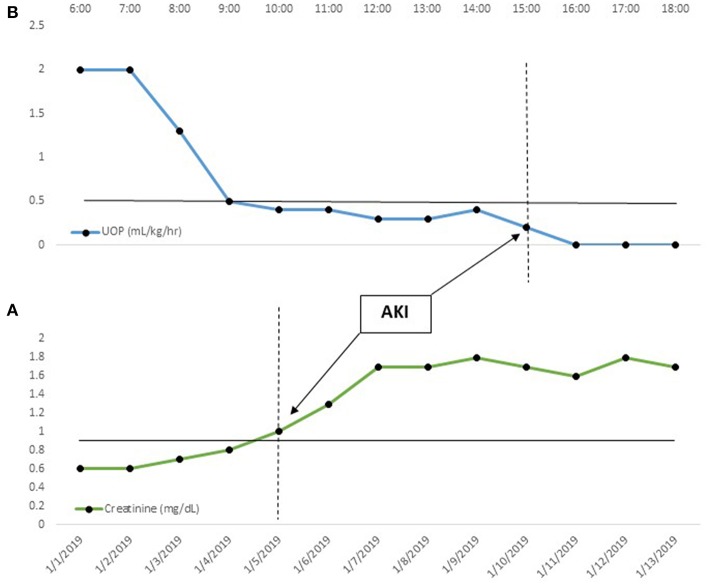
Figure 1.
Automated, Real-time AKI Identification. In this figure, temporal creatinine (daily) and urine output (hourly) trends are displayed. In (A), the creatinine gradually increases from a baseline of 0.6 mg/dL, meeting AKI criteria (serum creatinine > 1.5× baseline) on 1/5/19. Likewise, in (B), the patient develops progressive oliguria, meeting AKI criteria (UOP < 0.5 mL/kg/h for 6 h) at 15:00. In both cases, the ability to detect the threshold value upon documentation allows real-time diagnosis. This, in turn, opens up a myriad of big data AKI solutions.

