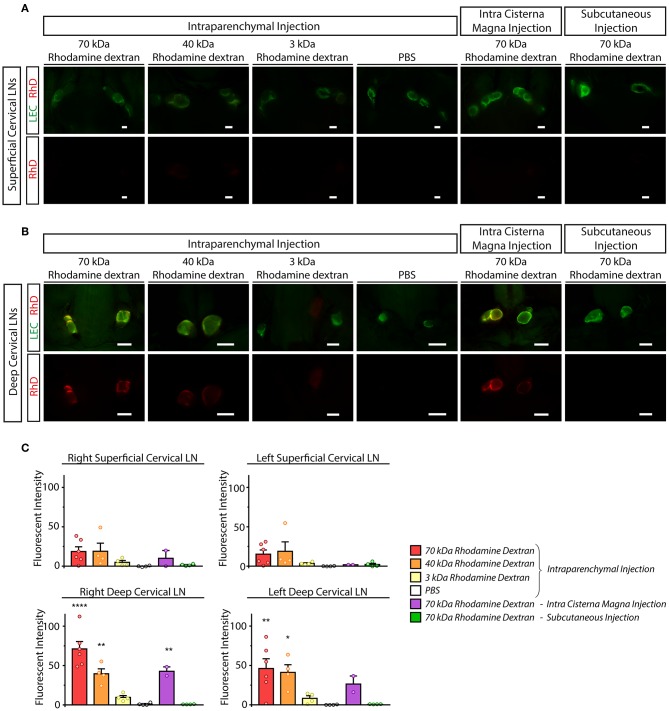
Figure 4.
Monitoring the drainage of macromolecules from the CNS to the superficial and deep cervical lymph nodes. (A,B) Accumulation of the injected labeled macromolecules in the superficial cervical lymph nodes (A) and deep cervical lymph nodes (B) of lymphatic reporter mice after intraparenchymal injection of 70, 40 and 3 kDa RhD, PBS, intra cisterna magna injection of 70 kDa RhD and subcutaneous injection of 70 kDa RhD at the same injection site which was used for the intraparenchymal injections (n = 6 for 70 kDa RhD intraparenchymal injection; n = 4 for 40 kDa RhD intraparenchymal injection; n = 4 for 3 kDa RhD intraparenchymal injection; n = 4 for PBS intraparenchymal injection; n = 2 for 70 kDa intra cisterna magna injection; n = 4 for 70 kDa RhD subcutaneous injection). Bars, 1,000 μm. Representative images are shown. (C) Quantitative data are shown for mean fluorescent intensity in the lymph nodes of the cervical region (mean fluorescent intensity of background subtracted from the mean fluorescent intensity of lymph nodes) compared to PBS injection (One-way ANOVA, Dunnett's post-hoc test; mean ± SEM; n = 3 or more animals for each group; n = 6 for 70 kDa RhD intraparenchymal injection; n = 4 for 40 kDa RhD intraparenchymal injection; n = 4 for 3 kDa RhD intraparenchymal injection; n = 4 for PBS intraparenchymal injection; n = 2 for 70 kDa intra cisterna magna injection n = 4 for 70 kDa RhD subcutaneous injection; *P < 0.05 vs. intraparenchymal PBS injection; **P < 0.01 vs. intraparenchymal PBS injection; ****P < 0.0001 vs. intraparenchymal PBS injection).

