
Figure 7.
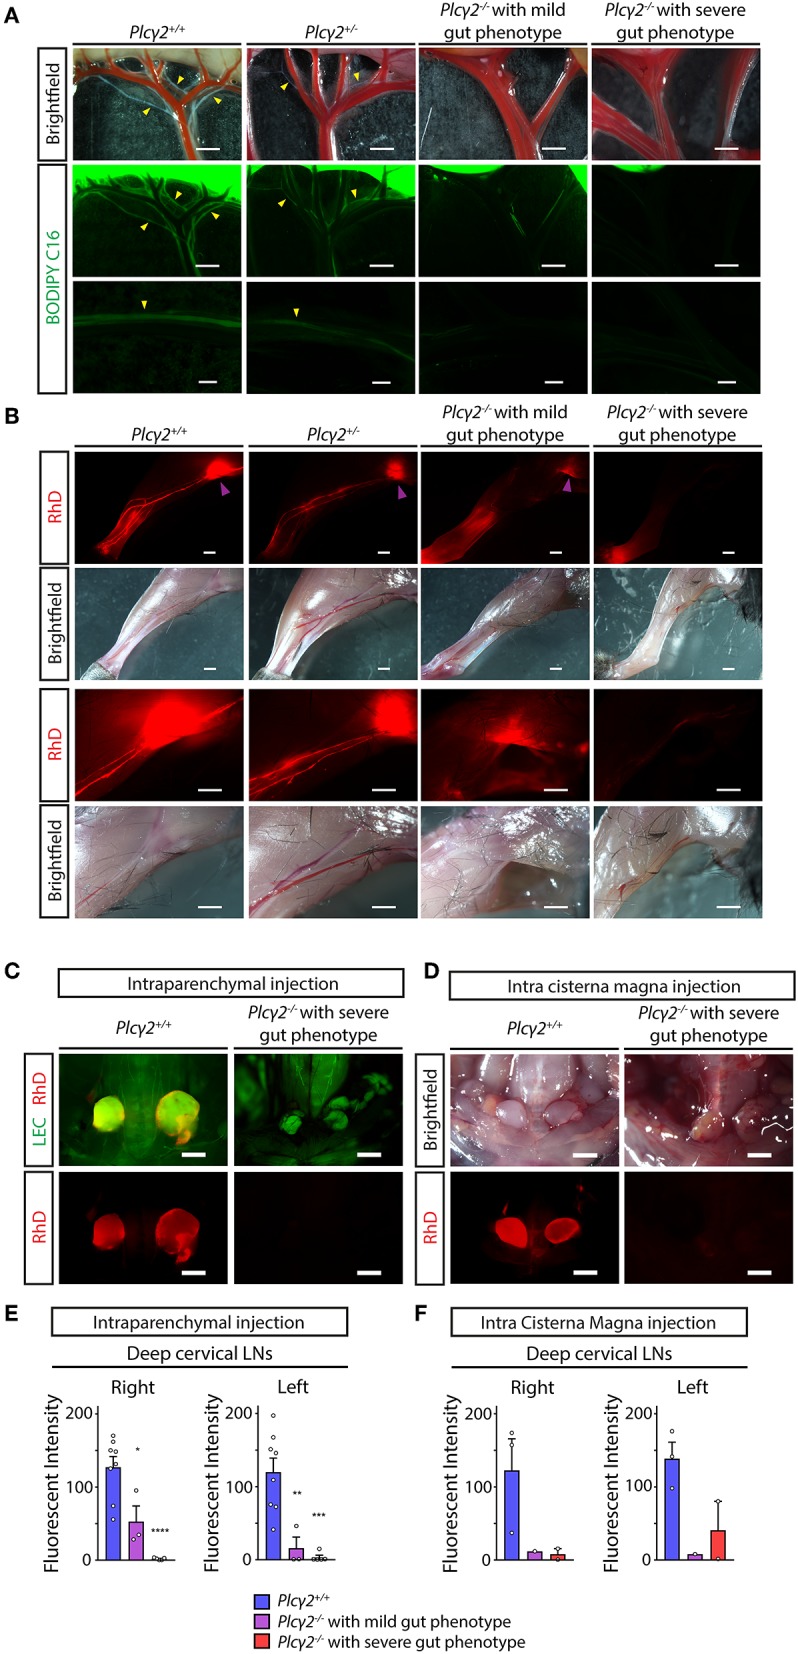
Characterization of lymphatic function in Plcγ2−/− and littermate control mice. (A) Representative images are shown for uptake and drainage of BODIPY C16 by mesenteric lymphatic vessels of young adult Plcγ2+/+, Plcγ2+/− and Plcγ2−/− mice with mild or severe gut phenotype 2 h after feeding with BODIPY C16. Yellow arrowheads point to lymphatic vessels draining BODIPY C16 (n = 6 mice for Plcγ2+/+, n = 3 mice for Plcγ2+/−, n = 2 mice for Plcγ2−/− mice with mild gut phenotype, n = 2 mice for Plcγ2−/− mice with severe phenotype). (B) Representative images are shown for uptake and drainage of 70 kDa RhD 100 min after subcutaneous injection to hind limb paws of young adult Plcγ2+/+, Plcγ2+/− and Plcγ2−/− mice with mild or severe gut phenotype. Purple arrowheads show RhD signal in popliteal lymph nodes (n = 6 mice for Plcγ2+/+, n = 3 mice for Plcγ2+/−, n = 2 mice for Plcγ2−/− mice with mild gut phenotype, n = 2 mice for Plcγ2−/− mice with severe gut phenotype). (C,D) Images shown for drainage of 70 kDa RhD into the deep cervical lymph nodes after intraparenchymal injection of the fluorescently labeled macromolecule to Plcγ2+/+ and Plcγ2−/− mice with severe gut phenotype on a Flt4YFP lymphatic reporter background (C) or injection of the tracer into cisterna magna of Plcγ2+/+ and Plcγ2−/− mice with severe gut phenotype (D) (n = 5 for intraparenchymal injection; n = 2 for intra cisterna magna injection). Bars, 1,000 μm. All images are representative. (E) Quantitative data are shown for mean fluorescent intensity in the deep cervical lymph nodes (mean fluorescent intensity of background subtracted from the mean fluorescent intensity of lymph nodes) after intraparenchymal injection of 70 kDa RhD into Plcγ2+/+ and Plcγ2−/− mice with severe or mild phenotype in the gut (Mean ± SEM; One-way ANOVA; Dunnett's post-hoc test; n = 8 for Plcγ2+/+ mice; n = 3 for Plcγ2−/− mice with mild gut phenotype, n = 5 for Plcγ2−/− mice with severe gut phenotype; *P < 0.05 vs. Plcγ2+/+; **P < 0.01 vs. Plcγ2+/+; ***P < 0.001 vs. Plcγ2+/+; ****P < 0.0001 vs. Plcγ2+/+). (F) Quantitative data are shown for drainage to the deep cervical lymph nodes (mean fluorescent intensity of background subtracted from the mean fluorescent intensity of lymph nodes) after intra cisterna magna injection of 70 kDa RhD into Plcγ2+/+ and Plcγ2−/− mice with severe or mild phenotype in the gut (Mean ± SEM; One-way ANOVA; Dunnett's post-hoc test; n = 3 for Plcγ2+/+ mice; n = 1 for Plcγ2−/− mice with mild gut phenotype, n = 2 for Plcγ2−/− mice with severe gut phenotype).