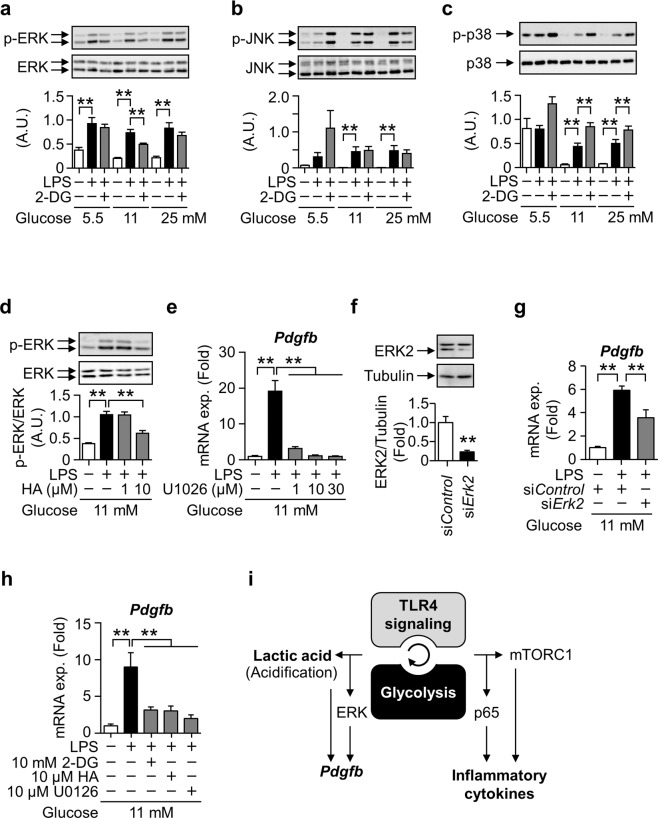
Figure 6.
Relevance of MAPK signaling pathways to LPS-induced Pdgfb mRNA expression coupled with glycolysis in macrophages. (a-c) Representative images blotted with anti-phospho-ERK1/2, anti-ERK, anti-phospho-JNK, anti-JNK, anti-phospho-p38, and anti-p38 antibodies, and relative signal density of phosphorylated protein normalized with that of each total protein in RAW264.7 cells pretreated with 10 mM 2-DG for 0.5 hours and stimulated with 100 ng/mL LPS for 3 hours. Mean of data among four independent experiments. n = 4. Statistical analyses were performed among the same glucose concentration. (d) Representative images blotted with anti-phospho-ERK1/2 and anti-ERK1/2 antibodies and the relative signal density of phospho-ERK2 normalized with that of ERK2 in RAW264.7 cells pretreated with HA for 0.5 hours and stimulated with 100 ng/mL LPS for 3 hours. Mean of data among three independent experiments. n = 4. (e) Relative expression levels of Pdgfb mRNA in RAW264.7 cells pretreated with U0126 for 2 hours and stimulated with 100 ng/mL LPS for 3 hours. Mean of data among three independent experiments. n = 6. (f) Representative images blotted with anti-ERK1/2 and anti-α-Tubulin antibodies, and the relative signal density of ERK2 normalized with that of α-Tubulin in siErk2-transfected RAW264.7 cells. Mean of data among three independent experiments. n = 3. (g) Relative expression levels of Pdgfb mRNA in RAW264.7 cells stimulated with 100 ng/mL LPS for 3 hours after the siErk2 transfection. Mean of data among six independent experiments. n = 6. (h) Relative expression levels of Pdgfb mRNA in BMDMs pretreated with 2-DG or HA for 0.5 hours, or U0126 for 2 hours and stimulated with 100 ng/mL LPS for 3 hours. n = 4. Data are shown as means ± S.E. *p < 0.05 and **p < 0.01, among two groups, as indicated. (i) A schematic illustration of divergent signaling pathways for gene induction from TLR4 signaling-coupled glycolytic metabolism in macrophages. Synergy promotes the induction of Pdgfb and inflammatory cytokine genes. Pdgfb mRNA expression is induced through the ERK signaling pathway and extracellular acidosis caused by lactic acid production, whereas that of inflammatory cytokine genes is induced through p65 NFκB and mTORC1. A.U., arbitrary unit; TLR4, toll-like receptor 4; mTORC1, mechanistic target of rapamycin complex 1.

