
Fig. 1. Mean sea-level change scenarios.
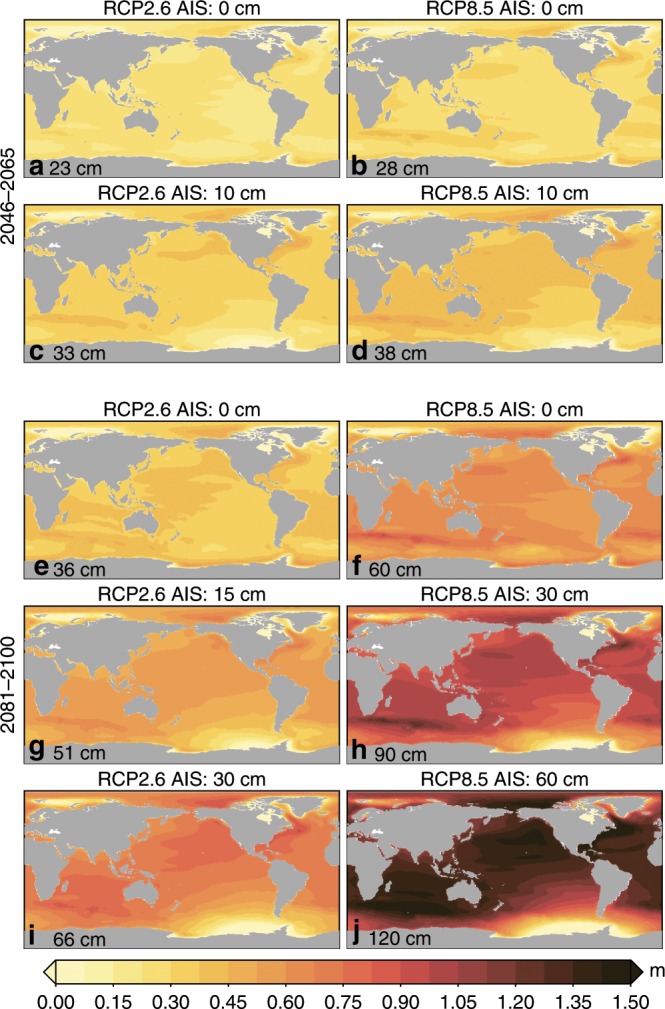
Selection of median regional IPCC AR5 MSL scenarios relative to the 1986–2005 baseline combined with various AIS contributions. The title of each panel shows the RCP scenario and the AIS contribution in cm. a–d 2046–2064. e–j 2081–2100 for varying RCP scenarios and AIS contributions. The number in the bottom left corner shows the corresponding global-mean sea-level change. See Supplementary Figs. 1–3 for all considered emission scenarios and accompanying uncertainty estimates.