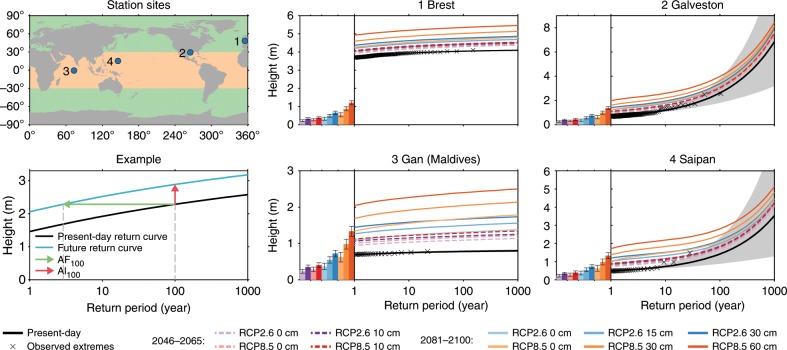
Fig. 2. Example return curves.
a The station sites and the regions that correspond with the tropics (orange) and extratropics (green). d An example return curve and the definition of the 100-year allowances (Al100) and amplification factors (AF100). The other panels show the present-day return curves and the curves after future MSL changes relative to 1986–2005 mean. The MSL changes are shown in the bar chart next to each panel. The numbers in the bar chart show the location (loc), scale (scl), and shape (shp) parameters of the return curve for the corresponding station. The shaded area shows the [5−95]% confidence interval of the present-day return curve, which is computed from the uncertainties in the estimated extreme-value distribution parameters, see methods for more details. The y-axis differs between sub-panels. Note that for Brest and Gan, the confidence interval is displayed, but small, compared to the scale of the graph.

