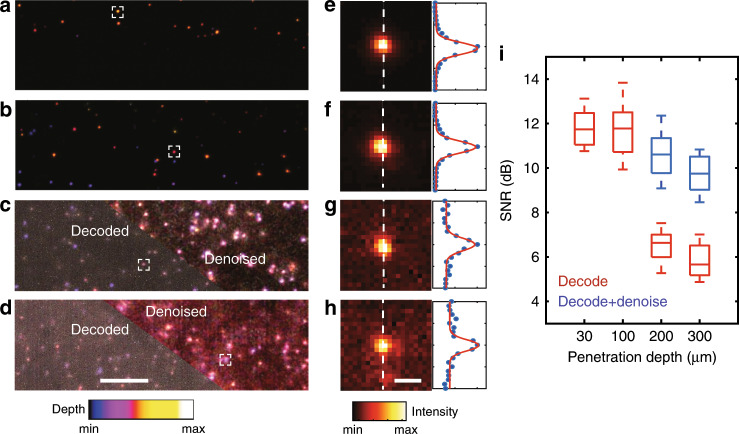
Fig. 4. Volumetric CLAM imaging of light-scattering fluorescence microbeads embedded in agarose gel.
The imaging depths are (a, e) 30 μm, (b, f) 100 μm, (c, g) 200 μm, and (d, h) 300 μm; the top right half of the images in (c, d) are denoised for a comparison. The depth is color-coded in (a–d). e–h show the maximum intensity projections (left) and linear intensity profiles (right) of the beads marked in (a–d). i SNR as a function of the penetration depth. Image denoising is applied for a comparison at the deeper depth. The scale bars represent 40 μm (a–d) and 5 μm (e–h).

