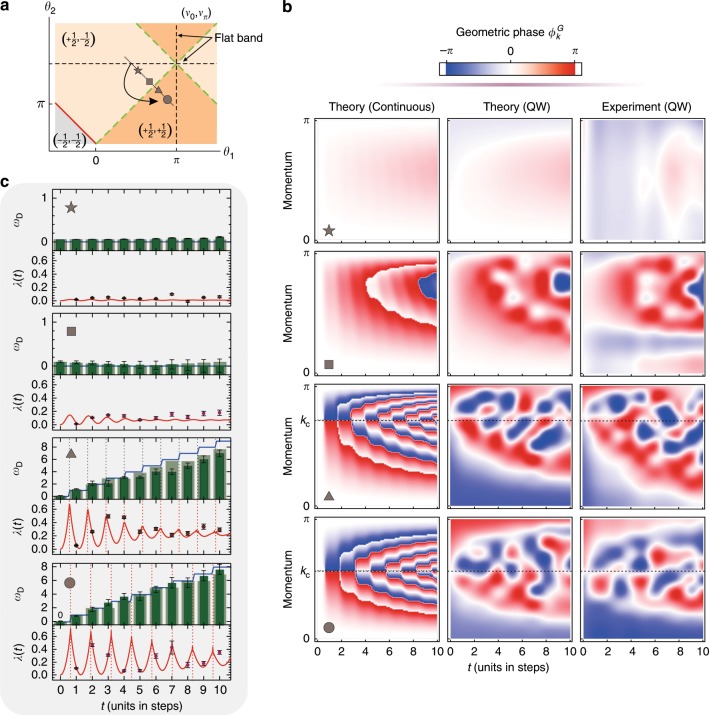
Fig. 4. Measurement of the DTOP for determining the phase boundary.
a The quenching strategies in terms of the phase diagram: we start the quench from the flat band (θ2 = π) and end the quench with different selected Hamiltonians, two Hamiltonians still in the trivial phase and two Hamiltonians in the nontrivial phase for a comparison; θ1 = 5π/9 and θ2 = 8π/9 for the pentagram, θ1 = 6π/9 and θ2 = 7π/9 for the square, θ1 = 7π/9 and θ2 = 6π/9 for the diamond, and θ1 = 8π/9 and θ2 = 5π/9 for the circle, which form a line crossing the phase boundary. b The density plots of the corresponding PGP for each case. In c, we show the corresponding rate function λ(t) and the DTOP ωD as a function of time. The lines are predicted in the continuous calculation. The points and opaque bars are the experimental results. The transparent bars are predictions from the simulation of the quantum walk. The errors are estimated using numerical Monte Carlo simulations considering the counting noise.

