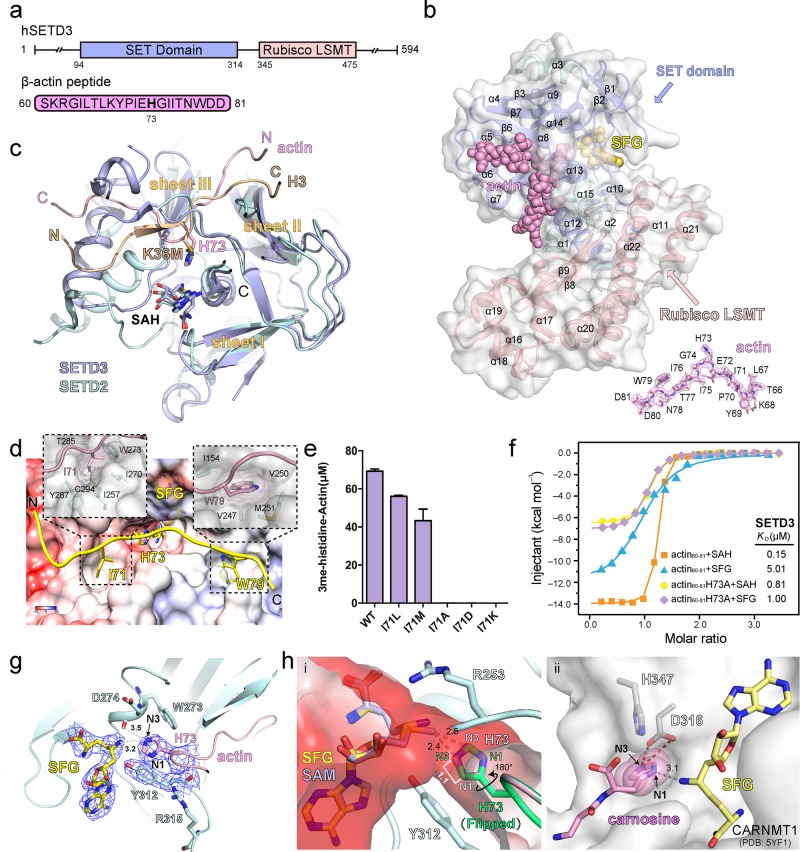
Fig. 1. Biochemical and structural characterizations of actin H73 methylation by SETD3.
a Domain architecture of human SETD3 and the sequence of actin peptide used for crystallization. b Overall structure of SETD320–494 bound to actin peptide and SFG. The SET domain and Rubisco LSMT domains of SETD3 are color-coded as indicated. SETD3 is also shown in semitransparent surface view. Actin peptide and SFG are depicted as pink and yellow spheres, respectively. Fo–Fc omit map of the actin peptide (66–81) is contoured at 3.0 σ level. c Structural alignment of SETD3 and SETD2 catalytic SET domains. SETD3 and SETD2 are depicted as blue and cyan ribbons, respectively. The histone H3K36M peptide in the SETD2 complex is shown as a dark- yellow ribbon, and the actin peptide in the SETD3 complex is shown as a light-pink ribbon. Sheets I, II, and III: three core β-sheets conserved among SET domains. Note the overlap of H73 of actin and H3K36M at the catalytic center next to the SAH cofactor. d Registration of the actin peptide along the substrate-binding channel of SETD3. Close-up view highlights the hydrophobic pockets for I71 and W79. The protein surface of SETD3 is represented in electrostatic potential view expressed as a spectrum ranging from −10 kT/e (red) to +10 kT/e (blue). e Catalytic activities of wild-type (WT) and indicated I71 mutants quantified by LC–MS. Error bars represent standard deviation of three repeats. f Calorimetric titration-fitting curves of SETD320–494 titrated with wild-type actin peptide or H73A mutant actin peptide in the presence of SFG or SAH, respectively. g Interaction details of the catalytic pocket. Electron densities of SFG, Y312 of SETD3, and H73 of actin peptide are shown as the Fo–Fc omit map contoured at 1.2 σ level. Numbers are distances in the unit of Å. h (i) “Head-to-head” engagement of SFG and actin H73 within the substrate channel of the catalytic center. The channel is colored as electrostatic potential surface as defined in panel d. A modeled SAM molecule is overlaid with SFG for analysis. A side-chain flipped histidine H73 is shown as overlaid green sticks. (ii) N1 position-specific methylation of carnosine by CARNMT1. Numbers are distances in the unit of Å.

