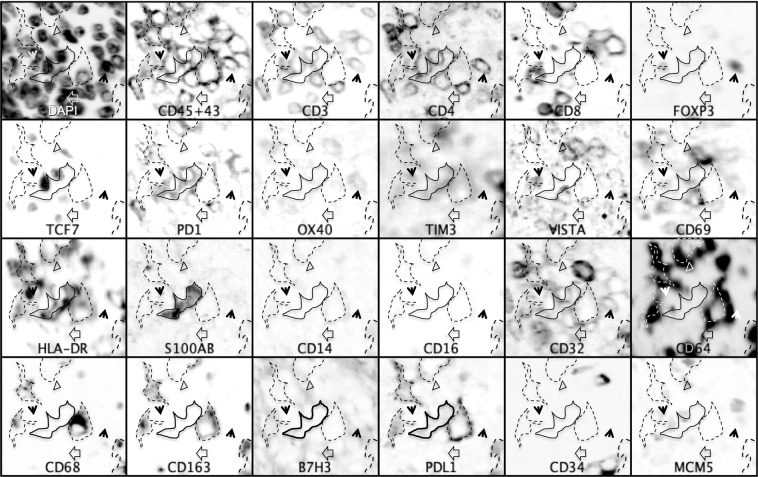
Figure 4.
T lymphocyte, macrophage and dendritic cell interactions in sarcomas. Inverted grayscale images of immunostained section detail from Case 14. PDL1+ macrophages expressing HLA-DR, CD16, CD64, CD68, CD163 and TIM3 are highlighted by a dashed line and are surrounded by PD1+ T cells, both CD8 and CD4. In the center, an HLA-DR+, S100AB+ CD14- dendritic cell is highlighted by a solid line. The empty arrowhead shows a CD8+, VISTA +, TCF7+ lymphocyte. The black arrowheads point to CD4+, FOXP3+, TCF7−, CD32±, OX40 ± regulatory T cells. The empty triangle points to a CD3+, CD8+, TCF7+, CD69+, VISTA+ lymphocyte. Note that TCF7 and FOXP3 are mutually exclusive. Negative markers are not represented. Image size 60 × 56 µm.

