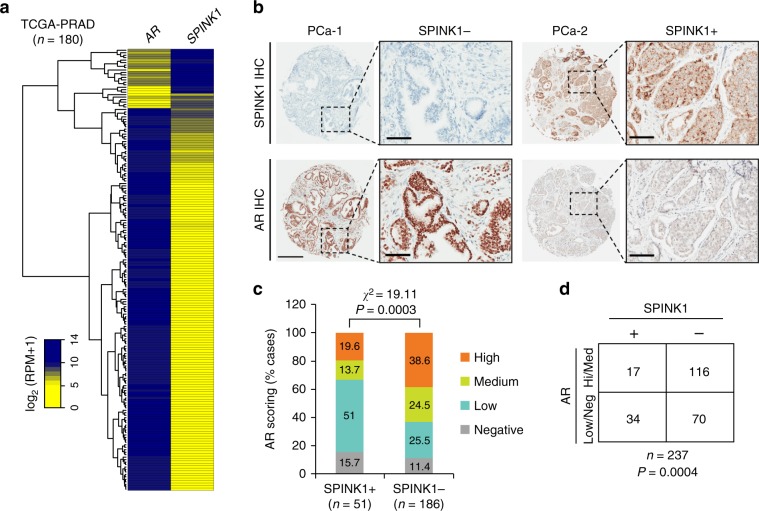
Fig. 1. SPINK1 is negatively correlated with AR in PCa patients.
a Heatmap depicting AR and SPINK1 expression in TCGA-PRAD cohort (n = 180). Shades of yellow and blue represents expression values in log2 (RPM+1). b Representative micrographs depicting PCa tissue microarray (TMA) cores (n = 237), immunostained for SPINK1 and AR expression by immunohistochemistry (IHC). Top panel shows representative IHC for SPINK1 in SPINK1-negative (SPINK1−) and SPINK1-positive (SPINK1+) patients. Bottom panel represents IHC for AR expression in the tumor core from same patients. Scale bar represents 500 µm and 100 µm for the entire core and the inset images, respectively. c Bar plot showing percentage of IHC scoring for AR in the SPINK1+ and SPINK1− patients’ specimens. P-value for the Chi-Square test is indicated. d Contingency table for the AR and SPINK1 status. Patients showing high or medium expression of AR were grouped as AR-(Hi/Med), while patients with low or null AR expression were indicated as AR-(Low/Neg). P-value for Fisher’s exact test is indicated.

