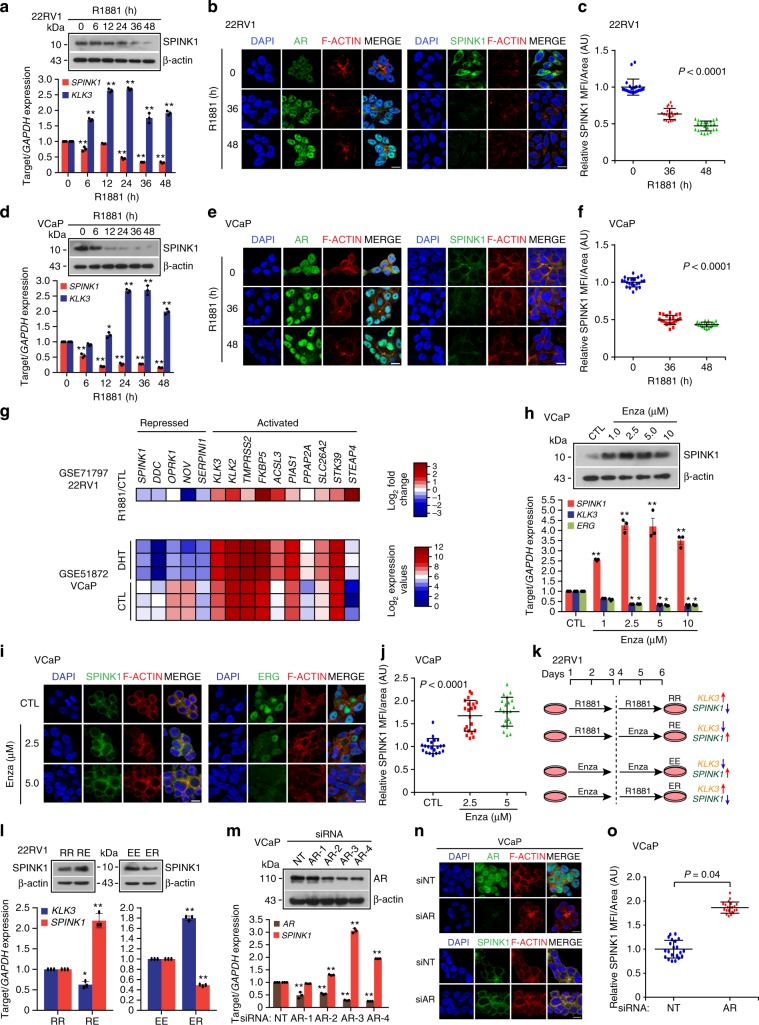
Fig. 2. Androgen signaling negatively regulates SPINK1 expression in prostate cancer.
a Immunoblot for SPINK1 in 22RV1 cells stimulated with R1881 (10 nM) (top). QPCR data showing relative expression of SPINK1 and KLK3 in the same cells (bottom). b Immunostaining for SPINK1 and AR in 22RV1 cells stimulated with R1881 (10 nM). c Same as b, except dot plot represents quantification for SPINK1 mean fluorescence intensity (MFI) per unit area shown as arbitrary units (AU). d Same as a, except VCaP cells were used. e Same as b, except VCaP cells were used. f Same as c, except quantification of VCaP cells as depicted in e. g Heatmap depicting relative expression of androgen regulated genes in androgen stimulated 22RV1 (top, GSE71797) and VCaP cells (bottom, GSE51872). h Immunoblot showing SPINK1 expression in VCaP cells treated with enzalutamide (top). QPCR data showing relative expression of SPINK1, KLK3, and ERG (bottom). i Immunostaining for SPINK1 and ERG using same cells as h. j Same as i, except dot plot represents quantification for SPINK1 fluorescence intensity. k Schema depicting sequential treatment of 22RV1 cells with R1881 (10 nM) and enzalutamide (10 µM). l Immunoblot showing SPINK1 expression in 22RV1 cells as indicated in k (top). QPCR data showing relative expression of SPINK1 and KLK3 using same cells in k (bottom). m Immunoblot for AR in AR-silenced and control VCaP cells (top). QPCR data showing relative expression of AR and SPINK1 using same cells (bottom). n Immunostaining for AR and SPINK1 using same cells as m. o Same as n, except dot plot represents quantification for SPINK1 fluorescence intensity. For panels b, e, i, n, scale bar represents 10 μm. For panels c, f, j, o, data represents mean ± SD using ten fields per experimental condition. For panels a, d, h, l, m, experiments were performed with n = 3 biologically independent samples; data represents mean ± SEM. For panels a, d, h, m two-way ANOVA, Dunnett’s multiple-comparisons test; (c, f, j) one-way ANOVA, Tukey’s multiple-comparisons test; (l) two-way ANOVA, Sidak’s multiple-comparisons test; (o) two-tailed unpaired Student’s t-test was applied. ∗P ≤ 0.05 and ∗∗P ≤ 0.001. Source data for a, d, h, l, m are provided as a Source Data file.

