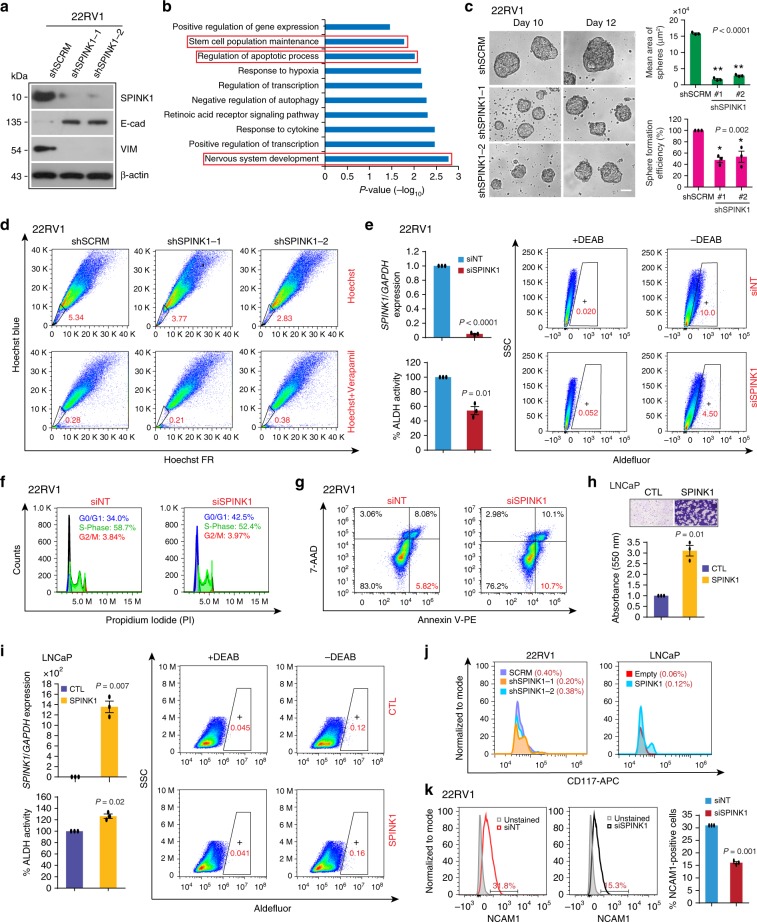
Fig. 4. SPINK1 promotes EMT, stemness and chemoresistance in prostate cancer.
a Immunoblot analysis for SPINK1, E-Cadherin and Vimentin levels in stable SPINK1-silenced (shSPINK1-1 and shSPINK1-2) and control (shSCRM) 22RV1 cells. b Biological pathways downregulated in 22RV1-shSPINK1 cells relative to 22RV1-shSCRM cells obtained by DAVID analysis. Bars represent −log10 (P-values). c Representative phase contrast microscopic images for the prostatospheres using same cells as a (left). Bar plots depict mean area and percent sphere formation efficiency of the prostatospheres (right). Scale bar represents 100 μm. d Hoechst-33342 staining for the side population analysis using same cells as a. Data was analyzed by putting blue and far-red filters, gated regions are marked in red for each panel. e QPCR data showing relative expression of SPINK1 in siRNA-mediated SPINK1-silenced 22RV1 cells (top, left). Quantification of ALDH activity using flow cytometry using same cells. Flow cytometric graphs showing fluorescence intensity of catalyzed ALDH substrate in the presence or absence of DEAB. Marked windows indicate percentage of ALDH1 positive cell population. f Flow cytometric analysis demonstrating cell-cycle arrest in SPINK1-silenced 22RV1 cells using propidium iodide (PI) DNA staining. g Flow cytometry analysis depicting cell apoptosis by Annexin V-PE and 7-AAD staining using same cells as e. h Transwell migration assay using stable SPINK1 overexpressing and control LNCaP cells. Top panel shows the representative microphotographs (scale bar = 100 µm) and bar plot depicts the data quantification (bottom). i Same assay as e, except LNCaP cells with transient overexpression of SPINK1 was used. j Flow cytometry analysis showing CD117-APC (c-KIT) expression using same cells as a and h. k Flow cytometry histograms depicting the expression of CD56-PE/Cy7 (NCAM1) using same cells as e. The cell populations were normalized to mode. Bar plot represents relative surface expression of NCAM1. Experiments were performed with n = 3 biologically independent samples; data represents mean ± SEM. For panel c one-way ANOVA, Dunnett’s multiple-comparisons test; e, h, i, k two-tailed unpaired Student’s t-test was applied. ∗P ≤ 0.05 and ∗∗P ≤ 0.001. The source data for a is provided as a Source Data file.

