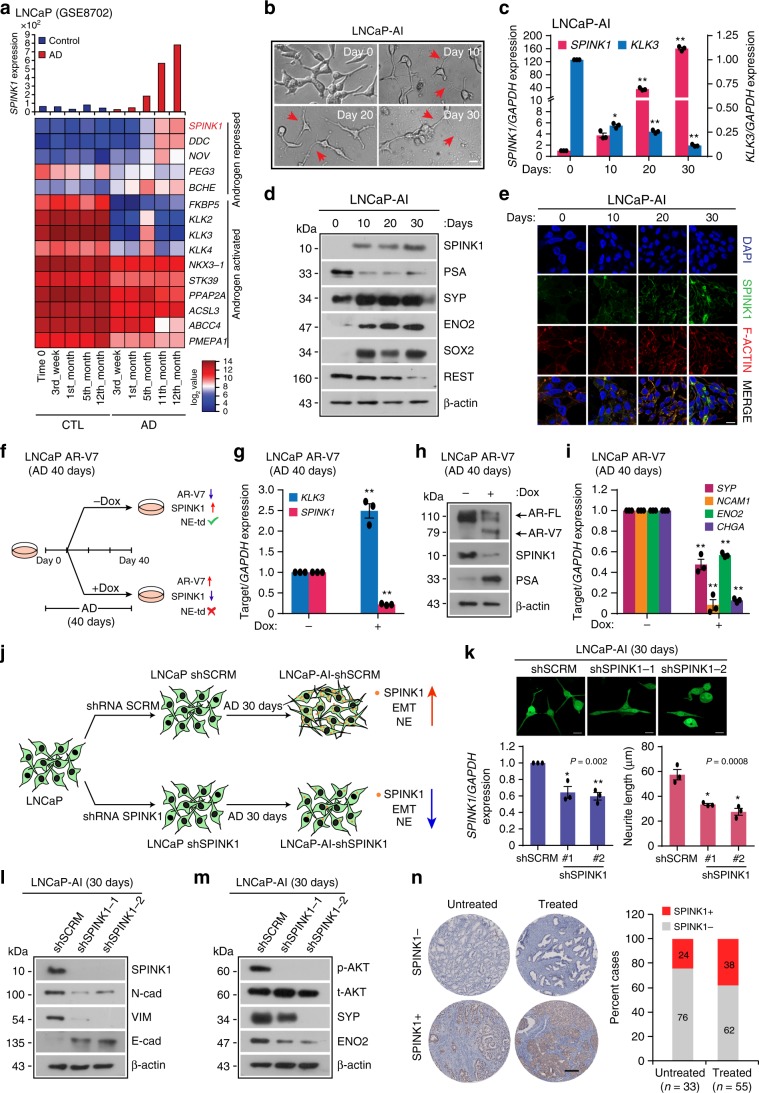
Fig. 5. Androgen-deprivation upregulates SPINK1 in NE-transdifferentiated PCa cells.
a Bar graph showing SPINK1 expression (top) and heatmap of AR-signaling associated genes including SPINK1 in long-term androgen deprived (AD) LNCaP cells (GSE8702). b Representative phase-contrast images of androgen-deprived LNCaP cells (LNCaP-AI). Red arrow-heads indicate neurite outgrowth. c QPCR data showing relative expression of SPINK1 and KLK3 using same cells as b. d Immunoblot assay for SPINK1, PSA, SYP, ENO2, SOX2 and REST using same cells as in b. e Immunostaining for SPINK1 using same cells as in b. f Schematic representation of NE-transdifferentiation (NE-td) using doxycycline (dox)-inducible AR-V7 overexpressing LNCaP cells subjected to androgen deprivation (AD) with or without induction (40 ng/ml) at day 10 and cultured upto 30 days. g QPCR data showing relative expression of SPINK1 and KLK3 using same cells as f. h Immunoblot assay for AR, AR-V7, SPINK1, and PSA using same cells as f. i QPCR data showing relative expression of SYP, NCAM1, ENO2 and CHGA using the same cells as f. j Schema describing generation of LNCaP-AI-shSPINK1 and LNCaP-AI-shSCRM cells by subjecting stable LNCaP-shSPINK1 and LNCaP-shSCRM cells to androgen deprivation (AD) for 30 days. k Representative images for the neurite outgrowths in LNCaP-AI-shSCRM cells and LNCaP-AI-shSPINK1 as j (top). QPCR data showing relative expression of SPINK1 (bottom, left) and measurement of neurite outgrowth (bottom, right). l Immunoblot analysis for SPINK1, E-Cad, VIM, and N-Cad expression using same cells as j. m Same as in l, except phospho (p) and total (t) AKT, SYP and ENO2 expression. n Representative IHC images for SPINK1 in SPINK1-negative (SPINK1−, top) and SPINK1-positive (SPINK1+, bottom) PCa tumor cores of the VPC tissue microarray (scale bar = 200 µm). Bar plot showing percentage cases of SPINK1 in untreated (n = 33) and neoadjuvant-hormone therapy (NHT) treated patients (n = 55). Experiments were performed with n = 3 biologically independent samples; data represents mean ± SEM. For panels b, e, k scale bar represents 20 µm. For panel c two-way ANOVA, Dunnett’s multiple-comparisons; g, i two-way ANOVA, Sidak’s multiple-comparisons test; k one-way ANOVA, Dunnett’s multiple-comparisons test were applied. ∗P ≤ 0.05 and ∗∗P ≤ 0.001. Source data for d, h, l, m are provided as a Source Data file.

