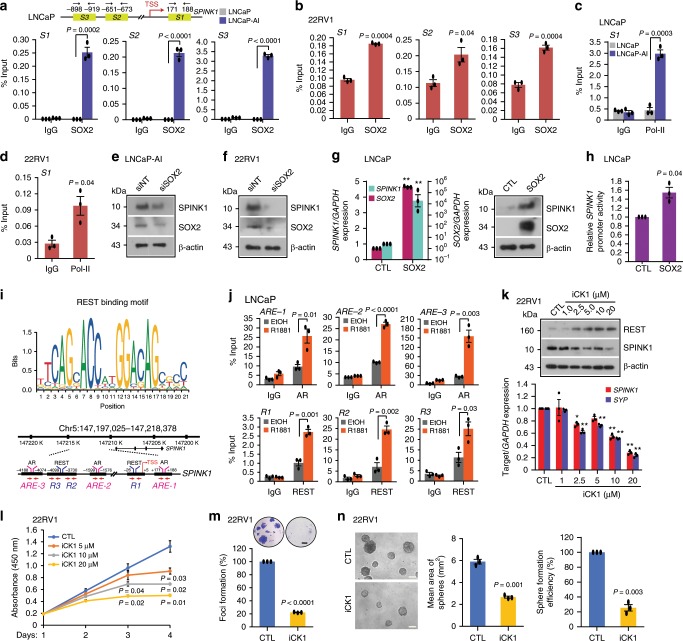
Fig. 6. Reprogramming factor SOX2 and AR transcriptional co-repressor REST modulate SPINK1 expression.
a Schematic showing SOX2 binding elements (S1, S2, and S3) on the SPINK1 promoter (top). ChIP-qPCR data for SOX2 occupancy on the SPINK1 promoter in wildtype LNCaP and LNCaP-AI cells (androgen-deprived for 15 days) (bottom). b Same as in a, except 22RV1 cells. c ChIP-qPCR data for RNA Pol-II binding on the SPINK1 promoter using cells as a. d Same as c, except 22RV1 cells. e Immunoblot for SOX2 and SPINK1 in siRNA mediated SOX2-silenced LNCaP-AI and control cells. f Same as e, except 22RV1 cells. g QPCR data showing relative expression of SOX2 and SPINK1 upon transient SOX2 overexpression in LNCaP cells (left). Immunoblot for SOX2 and SPINK1 expression(right). h Luciferase reporter activity of the SPINK1 distal-promoter (SPINK1-DP) using same cells as g. i REST binding motif obtained from JASPAR (top). Genomic location for AR and REST binding on the SPINK1 promoter (bottom). j ChIP-qPCR data showing AR and REST occupancy on the SPINK1 promoter in R1881 stimulated (10 nM) LNCaP cells. k Immunoblot for the REST and SPINK1 levels in 22RV1 cells treated with Casein Kinase 1 inhibitor (iCK1) as indicated (top). QPCR data for relative SPINK1 and SYP expression (bottom). l Cell proliferation assay using 22RV1 cells treated with different concentrations of iCK1. m Foci formation assay using 22RV1 cells treated with iCK1 (20 µM). Inset showing representative images depicting foci (scale bar: 500 µm). n Representative phase contrast microscopic images of 3D tumor spheroids using same cells as m (left). Bar plots depict mean area and efficiency of the sphere formation. Scale bar represents 1000μm. Experiments were performed with n = 3 biologically independent samples; data represents mean ± SEM. For panels a–d, h, j, m–n two-tailed unpaired Student’s t-test; g two-way ANOVA, Sidak’s multiple-comparisons test; k two-way ANOVA, Dunnett’s multiple-comparisons test were applied. ∗P ≤ 0.05 and ∗∗P ≤ 0.001. Source data for e, f, g, k are provided as a Source Data file.

