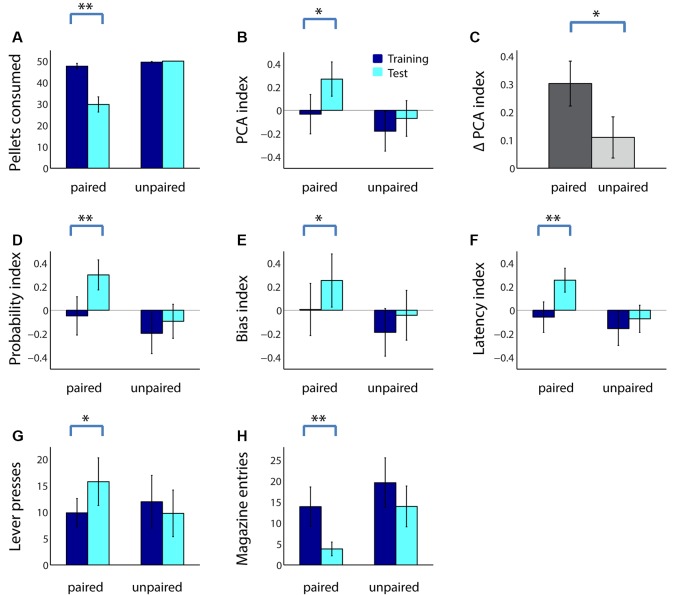
Figure 2.
Reward devaluation increases sign tracking and decreases goal tracking in adolescent rats. (A) The average number of sugar pellets consumed before (dark blue) and after (cyan) reward devaluation (paired group) or sham devaluation (unpaired group). (B) Average PCA index over the last 3 days of training dark (blue) and in the test session (cyan) for the paired and unpaired groups. Higher PCA index indicates more sign tracking relative to goal tracking. (C) Mean change in PCA index from training to test session for the paired (dark gray) and unpaired (light gray) groups. (D–F) Components of the PCA index. Average probability index (D), bias index (E), and latency index (F) over the last 3 days of training (dark blue) and in the test session (cyan) for the paired and unpaired groups. (G,H) Raw lever press count (G) and magazine entry count (H) over the last 3 days of training (dark blue) and in the test session (cyan) for the paired and unpaired groups. All panels, error bars indicate SEM. Double asterisk, p < 0.001; single asterisk, p < 0.05.

