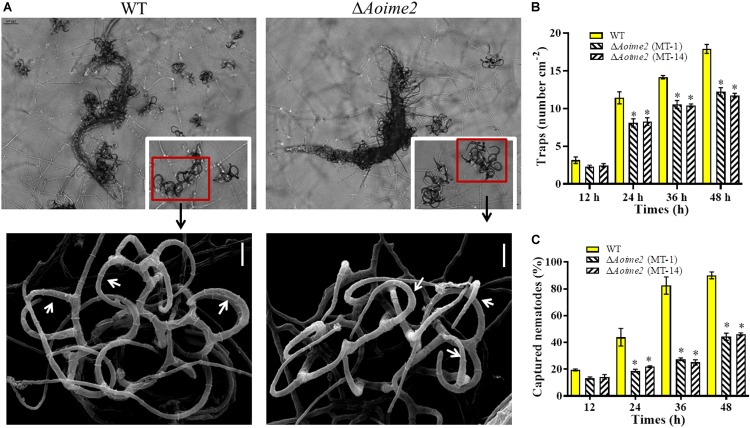
FIGURE 5.
Trap formation, trap morphology, and nematicidal activity of WT and ΔAoime2 mutants. (A) Trap formation and morphology (upper images: light microscopy; lower images: SEM) of WT and mutants after 48-h induction of traps by nematodes. Red boxes: traps produced by WT and ΔAoime2 mutants; arrows: hyphal loops in traps. (B) Comparison of traps produced by WT and mutants at 12, 24, 36 and 48 h. (C) Percentages of nematodes captured by WT and mutant strains at different time points. Bar = 10 μm. Error bars: SD from three replicates, asterisk: significant difference between mutant and WT (Tukey’s HSD, p < 0.05).

