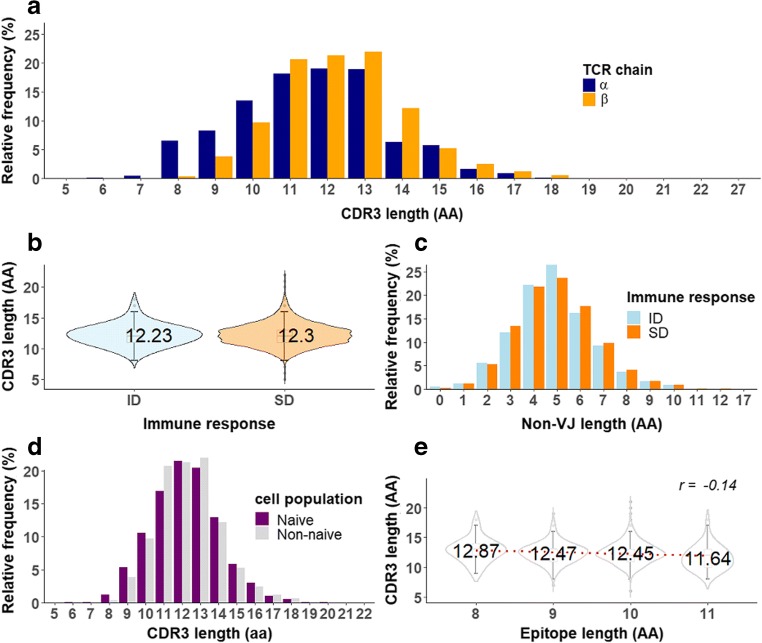
Fig. 2.
CDR3 length analysis. The distribution of CDR3α (n = 2008) and CDR3β (n = 5811) lengths are different (KS test, P < 0.0001). The left-shifted CDR3α distribution in relative to the CDR3β suggests a significantly shorter CDR3 in the TCR α chain (a). The similar distribution of entire CDR3β length (b) and the non-VJ region is observed in ID (n = 506) and SD responses (n = 5305) (c). The CDR3β length comparison between naive T cells (n = 3823) and non-naive population reviews significantly longer in the latter (KS test, P < 0.005) (d). The violin plots of non A2-restricted CDR3β (n = 2535) with the mean CDR3β length labels show a negative correlation between the length of epitope and CDR3β (spearman correlation, r = − 0.14). The paired comparison between CDR3β length at 8- to 10-amino acid epitopes with the 11-amino acid long confirms the significantly shorter CDR3β in the longer epitope (Mann–Whitney U test, all P < 0.0001) (e)

