Fig. 4.
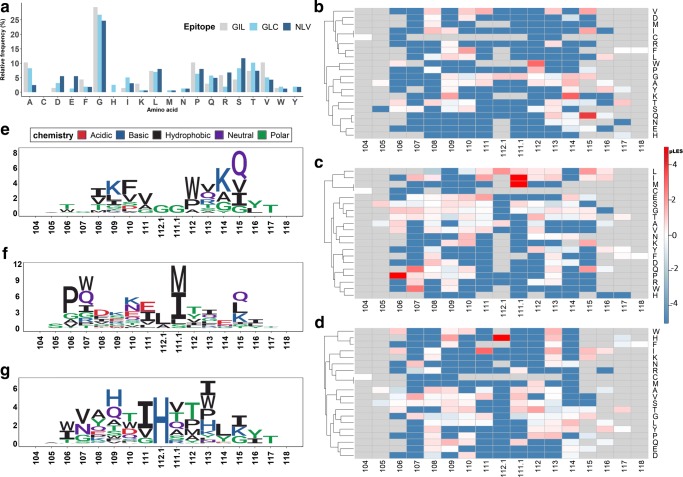
pLES heatmaps and corresponding sequence logos of CDR3 against the three prevalent epitopes: GIL, GLC, and NLV. Amino acid distributions (ID and SD combined) of CDR3 sequences against the three epitopes are similar (tested by Anderson–Darling k-sample test (Canada 1986)) (a). Log ratio of amino acid frequency in ID to SD at each CDR3 position from C104 to W/F118 are displayed in pLES heatmap. The positive (red) indicates enriched ID and the negative (blue) referred to enrichment in SD relative to ID. The gray color illustrates the absence of an amino acid at a certain position. GIL, GLC, and NLV (b–d) were converted into sequence logos which were created from positive pLES from antigen-specific CDR3 alignment (e–g)

