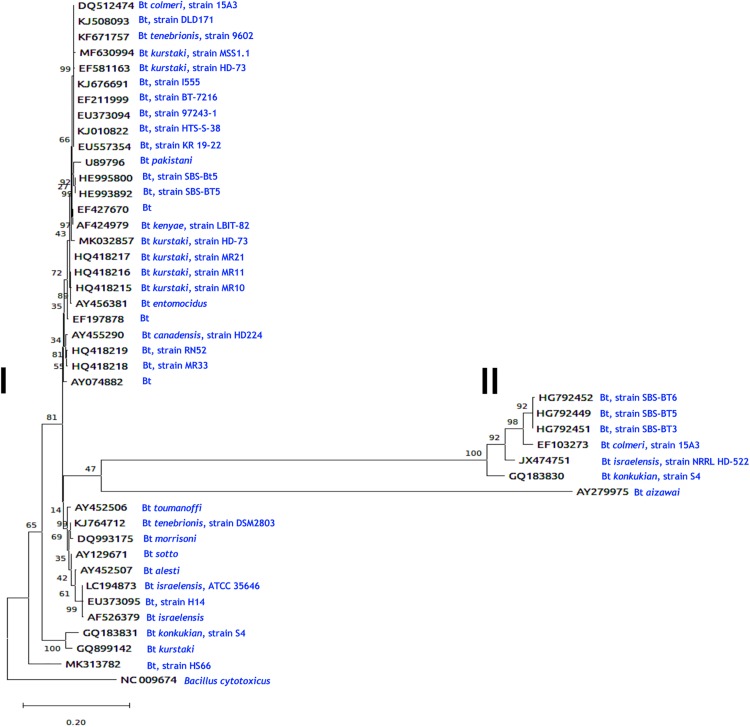
FIGURE 3.
Evolutionary analysis of Bacillus chitinases by the Maximum Likelihood method. The evolutionary history was inferred by using the Maximum Likelihood method and the General Time Reversible model (Nei and Kumar, 2000). The tree with the highest log likelihood (-13605.90) is shown. The percentage of trees in which the associated taxa clustered together is shown next to the branches. Initial tree(s) for the heuristic search were obtained automatically by applying Neighbor-Join and BioNJ algorithms to a matrix of pairwise distances estimated using the Maximum Composite Likelihood (MCL) approach and then selecting the topology with superior log likelihood value. A discrete Gamma distribution was used to model evolutionary rate differences among sites [5 categories (+G, parameter = 1.7979). The tree is drawn to scale, with branch lengths measured in the number of substitutions per site. This analysis involved 44 nucleotide sequences. There was a total of 3234 positions in the final dataset. Evolutionary analyses were conducted in MEGA X (Kumar et al., 2018). To elaborate this figure, information of the coding sequences of Bacillus thuringiensis chitinases reported to date in the GenBank nucleotide sequence database of the National Center for Biotechnology Information (https://www.ncbi.nlm.nih.gov/) were taken. Two main groups were distinguished, (I) and (II). After each accession numbers are indicated the B. thuringiensis (Bt) subspecies and/or the strain types (e.g., Bt colmeri, strain 15A3; Bt, strain DLD171) (see in blue) were chitinases were obtained. B. cytotoxicus was used as an external group. Additional information on the B. thuringiensis strains is shown in Table 1.

