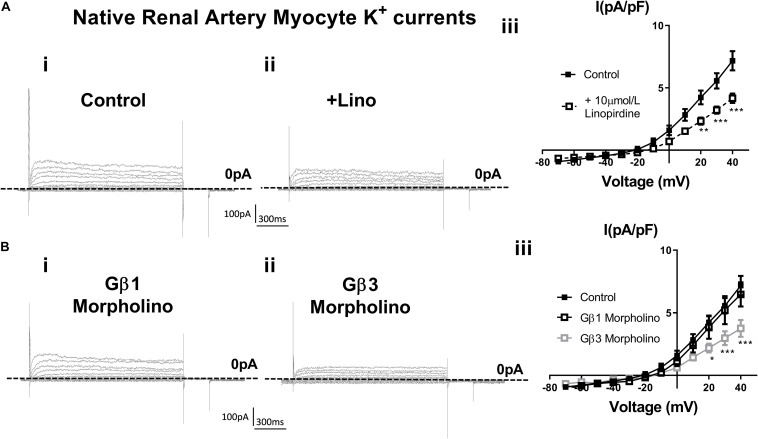
FIGURE 6.
K+ currents in renal artery myocytes – effects of linopirdine and β1 or β3 morpholino. (A) Representative images of whole cell K+ currents recorded in rat renal artery myocytes in control (i) or in the presence of 10 μm/L linopirdine (ii), and mean data [iii, n = 17 N = 4 (control), n = 9 N = 4 (linopirdine)]. Zero current is indicated by the dashed line. (B) Representative images of whole cell K+ currents recorded in rat renal artery myocytes after morpholino knockdown of Gβ1 (i) or Gβ3 (ii) and mean data [iii, n = 10 N = 4 (Gβ1), n = 8 N = 4 (Gβ3)]. Zero current is indicated by the dashed line. “n” = number of cells and “N” = number of animals. Data was analyzed by Bonferroni post hoc test following a two-way ANOVA. p < 0.05 is denoted (∗), p < 0.01 is denoted (∗∗), and p < 0.005 is denoted (∗∗∗).

