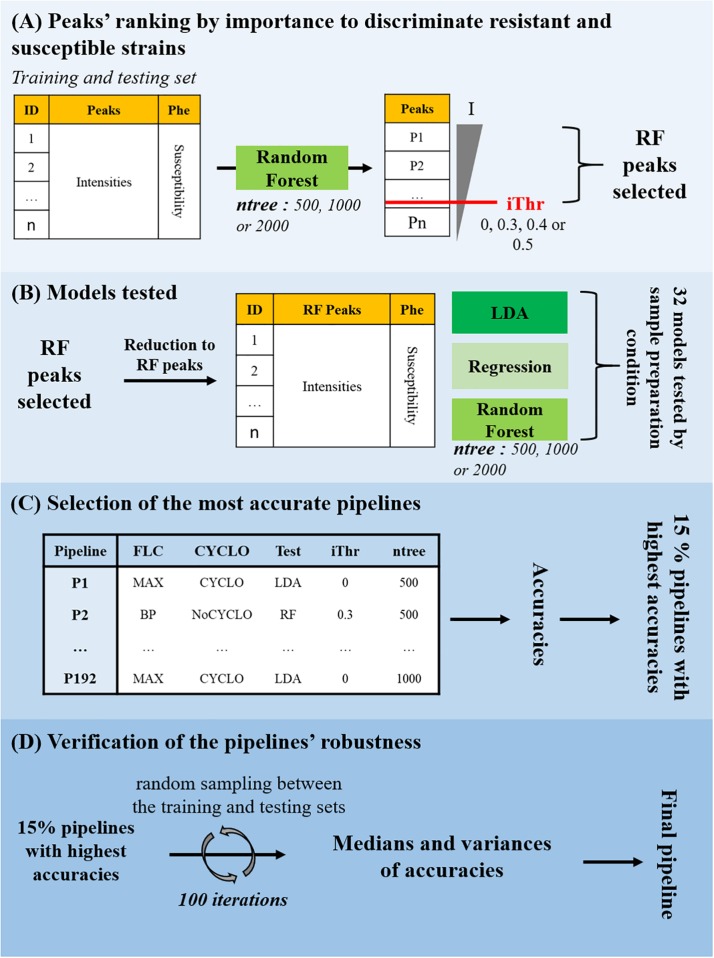
FIGURE 2.
Fluconazole resistance detection by machine-learning approach. (A) Peaks’ ranking by importance to discriminate resistant and susceptible strains. A model based on the Random Forest (RF) classifier was trained on the training set and tested on the testing set to separate the fluconazole-resistant strains from the fluconazole-susceptible ones depending on the peaks’ intensities. Three values of number of trees to grow (ntree) were tested. The peaks were ranked by their associated Mean Decrease in Gini index (I) and four Decrease in Gini index thresholds (iThr = 0, 0.3, 0.4, 0.5) were arbitrarily set to extract a list of discriminating peaks (RF Peaks). (B) Models testing. The intensity matrix was reduced to the RF peaks and RF, logistic regression and LDA models were trained and tested to separate the fluconazole-resistant strains from the fluconazole-susceptible ones depending on the peaks’ intensities. In total, 32 models were tested on each of the 6 subsets, for a total of 192 pipelines of analysis from sample preparation to resistance prediction, each associated to a specific accuracy. (C) Selection of the most accurate pipelines. The 15% pipelines corresponding to the highest accuracies were selected. (D) Verification of the pipelines’ robustness. The training and testing set associated to each of the 15% best accurate pipelines were merged and randomly split (ratio 2:1) in new training and testing sets. The model was trained on the new training set and the accuracy of the susceptibility level prediction on the testing set was stored. This process was iteratively repeated 100 times to generated as many different training/testing set combinations. The pipeline associated with a high median of accuracies and a low variance of accuracies was selected for validation.

