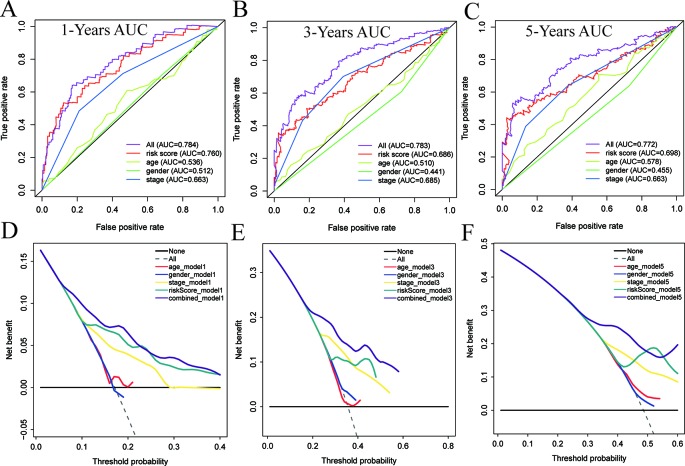
Figure 9.
The time-dependent receiver operating characteristic (ROC) and decision curve analysis (DCA) curves of the nomograms. Time-dependent ROC curve analysis evaluates the accuracy of the nomograms (A–C). The purple, red, yellow, green, or blue solid line represents the nomogram. The DCA curves can intuitively evaluate the clinical benefit of the nomograms and the scope of application of the nomograms to obtain clinical benefits (D–F). The net benefits (Y-axis) as calculated are plotted against the threshold probabilities of patients having 1, 3-, and 5-year survival on the X-axis. The gray dotted line represents the assumption that all patients have 1-, 3-, and 5-year survival. The black solid line represents the assumption that no patients have 1-, 3-, or 5-year survival. The red, blue, yellow, green, or purple solid line represents the nomograms.

