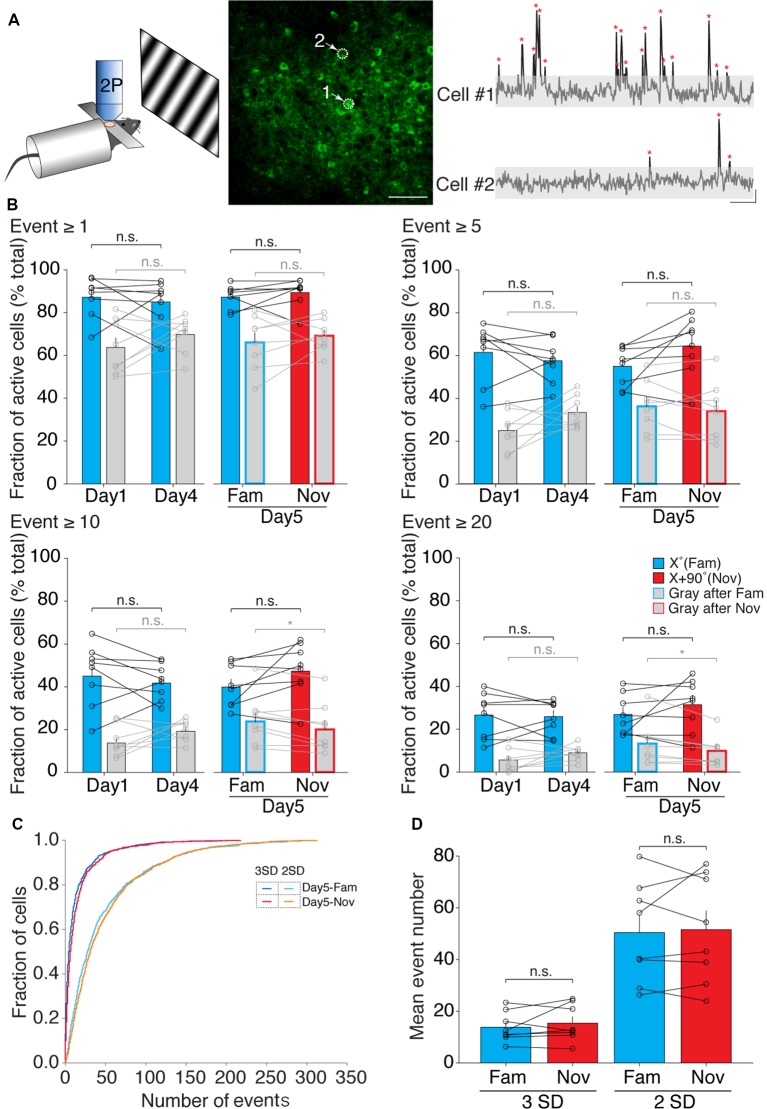
Figure 2.
The fraction of active neurons in layer 4 of binocular V1 during a familiar visual stimulus presentation does not change following SRP induction. (A) Left: schematic of in vivo two-photon calcium imaging setup with visual stimulation. Middle: two-photon image of a field of view. White arrows and dotted circles indicate two individual cells undergoing imaging. Scale bar, 50 μm. Right: example of calcium traces from the two cells indicated in the middle image. Calcium transient peaks (red asterisk), 3 standard deviations (SDs) above the noise (gray shading), were used for analysis. Scale bar, 10 s, 20% ΔF/F. (B) The fraction of active neurons on day 1 and day 4 following SRP induction, as well as on day 5 during presentation of the familiar (Fam) and novel (Nov) visual stimulus does not change irrespective of whether neurons show few (≥1) or many (≥20) calcium events during presentation of the grating visual stimulus (Paired t-test, n.s.). Gray bars indicate the fraction of responsive neurons during the time when a gray screen was present on the monitor. (C) Cumulative distribution of the number of calcium transients of all cells (n = 929 cells from eight animals) on day 5 during the familiar visual stimulus and novel, with two different thresholds (3 SD: blue and red; 2 SD: cyan and orange) for calcium event. (D) Mean event number of all cells during presentation of the familiar visual stimulus and novel stimulus on day 5, with two different thresholds (3 SD and 2 SD) for calcium event. Averaged by animal (n = 8; 3 SD: familiar, 13.79 ± 2.03; novel, 15.35 ± 2.47, paired t-test p = 0.384; 2 SD: familiar, 50.41 ± 6.85; novel, 51.54 ± 7.28, paired t-test p = 0.736). Error bars indicate SEM. *p < 0.05, n.s. = p > 0.05.

